Marked Zone
The Marked Zone feature allows you to place a rectangle inside the ChartArea. This allows you to mark a specific part of it, in order to easily look at all the data that belongs to this area. In order to creat a Marked Zone you have to use the MarkedZone class and add an instance of it to the Annotations collection of the ChartArea. You also have to set its StartY and EndY properties for a rectangle that spans along the entire X-Axis, or the StartX and EndX properties for a rectangle that spans along the entire Y-Axis, or set the four properties at once in order to create a rectangle that is limited in both directions.
You can place more than one MarkedZone__in your __ChartArea.
The StartX, EndX, StartY and EndY are of type double. Therefore, if the respective axis displays DateTime values, you have to pass converted to OLE Automation dates to them. For more information see DateTime.ToOADate().
In order to customize the appearance of the MarkedZone you can simply set its Background property, Stroke (will change its color) and its StrokeThickness (will change the thickness of the line).
If you have multiple y-axes, you can specify to which the MarkedZone should be applied by setting the x:Name value of the appropriate Y-Axis to the YAxisName property of the MarkedZone.
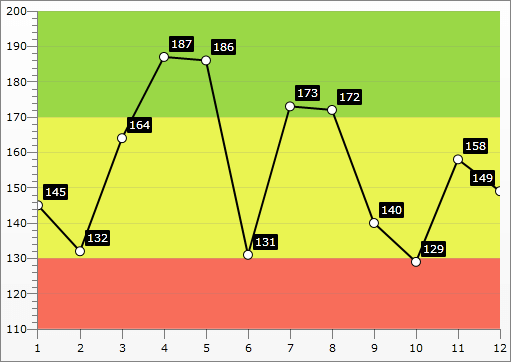
The following code snippet demonstrates a RadChart with LineSeries that will be used as base for adding MarkedZones over:
DataSeries series1 = new DataSeries()
 {
   new DataPoint(145),
   new DataPoint(132),
   new DataPoint(164),
   new DataPoint(187),
   new DataPoint(186),
   new DataPoint(131),
   new DataPoint(173),
   new DataPoint(172),
   new DataPoint(140),
   new DataPoint(129),
   new DataPoint(158),
   new DataPoint(149)
 };
series1.Definition = new LineSeriesDefinition();
series1.Definition.Appearance.Fill = new SolidColorBrush(Colors.Black);
series1.Definition.Appearance.Stroke = new SolidColorBrush(Colors.Black);
series1.Definition.Appearance.PointMark.Stroke = new SolidColorBrush(Colors.Black);
this.radChart.DefaultView.ChartArea.DataSeries.Add(series1);
InitializeComponent()
Dim series1 As New DataSeries() With
{ New DataPoint(145),
New DataPoint(132),
New DataPoint(164),
New DataPoint(187),
New DataPoint(186),
New DataPoint(131),
New DataPoint(173),
New DataPoint(172),
New DataPoint(140),
New DataPoint(129),
New DataPoint(158),
New DataPoint(149)
}
series1.Definition = New LineSeriesDefinition()
series1.Definition.Appearance.Fill = New SolidColorBrush(Colors.Black)
series1.Definition.Appearance.Stroke = New SolidColorBrush(Colors.Black)
series1.Definition.Appearance.PointMark.Stroke = New SolidColorBrush(Colors.Black)
RadChart1.DefaultView.ChartArea.DataSeries.Add(series1)
<telerik:RadChart x:Name="radChart">
    <telerik:RadChart.DefaultView>
        <telerik:ChartDefaultView>
            <telerik:ChartDefaultView.ChartArea>
                <telerik:ChartArea>
                    <telerik:ChartArea.Annotations>
                        <telerik:MarkedZone Tag="RedZone"
                                            Background="#FFF86D5A"
                                            StartY="110"
                                            EndY="130" />
                        <telerik:MarkedZone x:Name="YellowZone"
                                            Background="#FFEAF451"
                                            StartY="130"
                                            EndY="170" />
                        <telerik:MarkedZone Tag="GreenZone"
                                            Background="#FF9AD846"
                                            StartY="170"
                                            EndY="200" />
                    </telerik:ChartArea.Annotations>
                </telerik:ChartArea>
            </telerik:ChartDefaultView.ChartArea>
        </telerik:ChartDefaultView>
    </telerik:RadChart.DefaultView>
</telerik:RadChart>
MarkedZone redZone = new MarkedZone();
redZone.StartY = 110;
redZone.EndY = 130;
redZone.Background = new SolidColorBrush( Color.FromArgb( 255, 248, 109, 90 ) );
MarkedZone yellowZone = new MarkedZone();
yellowZone .StartY = 130;
yellowZone .EndY = 170;
yellowZone .Background = new SolidColorBrush( Color.FromArgb( 255, 234, 244, 81 ) );
MarkedZone greenZone = new MarkedZone();
greenZone.StartY = 170;
greenZone.EndY = 200;
greenZone.Background = new SolidColorBrush( Color.FromArgb( 255, 154, 216, 70 ) );
this.radChart.DefaultView.ChartArea.Annotations.Add(redZone);
this.radChart.DefaultView.ChartArea.Annotations.Add(yellowZone);
this.radChart.DefaultView.ChartArea.Annotations.Add(greenZone);
Dim redZone As New MarkedZone()
redZone.StartY = 110
redZone.EndY = 130
redZone.Background = New SolidColorBrush(Color.FromArgb(255, 248, 109, 90))
Dim yellowZone As New MarkedZone()
yellowZone.StartY = 130
yellowZone.EndY = 170
yellowZone.Background = New SolidColorBrush(Color.FromArgb(255, 234, 244, 81))
Dim greenZone As New MarkedZone()
greenZone .StartY = 170
greenZone .EndY = 200
greenZone .Background = New SolidColorBrush(Color.FromArgb(255, 154, 216, 70))
Me.radChart.DefaultView.ChartArea.Annotations.Add(redZone)
Me.radChart.DefaultView.ChartArea.Annotations.Add(yellowZone)
Me.radChart.DefaultView.ChartArea.Annotations.Add(greenZone)
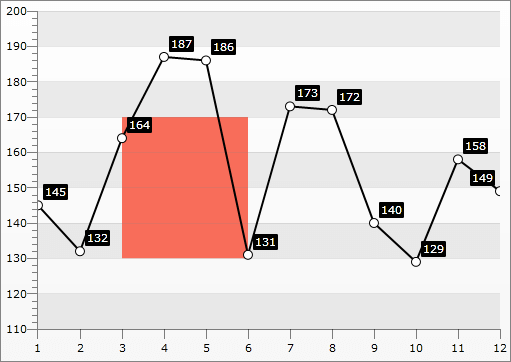
Here is an example of a marked zone that is limited in both directions.
<telerik:RadChart>
    <telerik:RadChart.DefaultView>
        <telerik:ChartDefaultView>
            <telerik:ChartDefaultView.ChartArea>
                <telerik:ChartArea>
                    <telerik:ChartArea.Annotations>
                        <telerik:MarkedZone Tag="LimitedZone"
                                            Background="#FFF86D5A"
                                            StartY="130"
                                            EndY="170"
                                            StartX="3"
                                            EndX="6" />
                    </telerik:ChartArea.Annotations>
                </telerik:ChartArea>
            </telerik:ChartDefaultView.ChartArea>
        </telerik:ChartDefaultView>
    </telerik:RadChart.DefaultView>
</telerik:RadChart>
This can be done in code behind too!
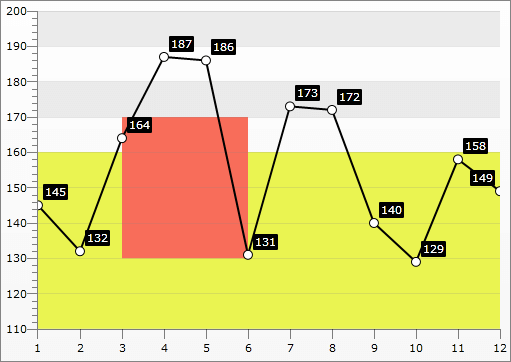
The Marked Zones can overlap each other. In such case their Z-Index will be used to determine which will appear above. Here is an example.
<telerik:RadChart>
    <telerik:RadChart.DefaultView>
        <telerik:ChartDefaultView>
            <telerik:ChartDefaultView.ChartArea>
                <telerik:ChartArea>
                    <telerik:ChartArea.Annotations>
                        <telerik:MarkedZone Tag="YellowZone"
                                            Background="#FFEAF451"
                                            StartY="110"
                                            EndY="160" />
                        <telerik:MarkedZone x:Name="LimitedZone"
                                            Background="#FFF86D5A"
                                            StartY="130"
                                            EndY="170"
                                            StartX="3"
                                            EndX="6" />
                    </telerik:ChartArea.Annotations>
                </telerik:ChartArea>
            </telerik:ChartDefaultView.ChartArea>
        </telerik:ChartDefaultView>
    </telerik:RadChart.DefaultView>
  </telerik:RadChart>
This can be done in code behind too!
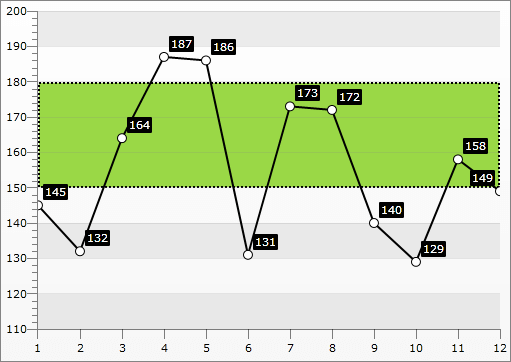
Additional customizations can be done via the ElementStyle property. It gets applied to the Rectangle element that visually represents the MarkedZone. Via this style you can set the StrokeDashArray property for example.
<FrameworkElement.Resources>
    <Style x:Key="MarkedZoneStyle"
    TargetType="Rectangle">
        <Setter Property="StrokeDashArray"
        Value="1,1" />
    </Style>
</FrameworkElement.Resources>

<telerik:RadChart>
    <telerik:RadChart.DefaultView>
        <telerik:ChartDefaultView>
            <telerik:ChartDefaultView.ChartArea>
                <telerik:ChartArea>
                    <telerik:ChartArea.Annotations>
                        <telerik:MarkedZone Tag="GreenZone"
                                    Background="#FF9AD846"
                                    StartY="150"
                                    EndY="180"
                                    Stroke="Black"
                                    StrokeThickness="2"
                                    ElementStyle="{StaticResource MarkedZoneStyle}" />
                    </telerik:ChartArea.Annotations>
                </telerik:ChartArea>
            </telerik:ChartDefaultView.ChartArea>
        </telerik:ChartDefaultView>
    </telerik:RadChart.DefaultView>
</telerik:RadChart>
This can be done in code behind too!