TrackBall Behavior
The ChartTrackBallBehavior can display a vertical line across the chart plot area and also displayvisual indicators (rectangle by default) at points where the trackball line crosses the visualization of a series object.
Properties
Here are listed all properties exposed by the ChartTrackBallBehavior class:
- ShowInfo (bool): Determines whether the visual information for all the closest data points will be displayed.
- ShowIntersectionPoints (bool): Determines whether a visual representation for all the intersection points will be displayed.
-
SnapMode (TrackBallSnapMode): Gets or sets how this behavior should snap to the closest to a physical location data points.
- None: The trackball will not be snapped to any of the closest data points.
- ClosestPoint: The behavior will snap to the closest data point, regardless of the chart series that own it.
- AllClosePoints: The behavior will snap to the closest data points from all chart series.
-
InfoMode (TrackInfoMode): Gets or sets a value indicating whether the track information will displayed be displayed for whole series or individual data points.
- Multiple: Each series information is displayed in a box on top of the plot area.
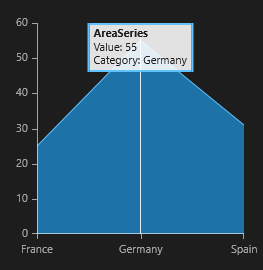
- Individual: A tooltip-like box is displayed next to each intersection data point.
- TrackInfoTemplate (attached property): Specifies the DataTemplate for the displayed information on a per series/indicator basis. This property has to be attached to a chart series/indicator.
- IntersectionTemplate (attached property): Specifies the DataTemplate for the intersection point on a per series/indicator basis. This property has to be attached to a chart series/indicator.
- LineStyle (Style): Gets or sets the Style that defines the appearance of the vertical line that marks the position of the trackball. The Style should target the Polyline type.
- InfoStyle: Gets or sets the Style that defines the appearance of the TrackInfo control displayed by a ChartTrackBallBehavior instance. The Style should target the TrackBallInfoControl type defined in the Telerik.UI.Xaml.Controls.Chart.Primitives namespace. >The InfoStyle property affects the Style of the TrackBallInfoControl only when the ChartTrackBallBehavior.InfoMode isMultiple.
And here is the definition of the ChartTrackBallBehavior in XAML:
<telerikChart:RadCartesianChart.Behaviors>
    <telerikChart:ChartTrackBallBehavior  InfoMode="Multiple"/>
</telerikChart:RadCartesianChart.Behaviors>
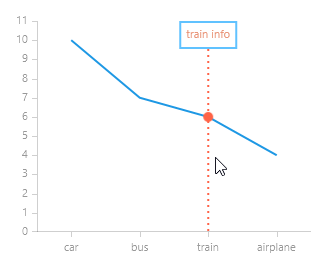
Customization example
This example will demonstrate how you can completely customize the TrackBallInfoBehavior:
- display custom information about the data item;
- change the style of the information box;
- change the style of the line;
- change the template of the intersection point with the series line.
First, let us create a data class.
public class Data
{
    public double Value { get; set; }

    public string Category { get; set; }

    public string Info { get; set; }
}
Here is the definition of the chart control with custom styles for the track ball elements.
<telerikChart:RadCartesianChart x:Name="chart" Width="300" Height="250">
    <telerikChart:RadCartesianChart.HorizontalAxis>
        <telerikChart:CategoricalAxis PlotMode="OnTicksPadded"/>
    </telerikChart:RadCartesianChart.HorizontalAxis>
    <telerikChart:RadCartesianChart.VerticalAxis>
        <telerikChart:LinearAxis/>
    </telerikChart:RadCartesianChart.VerticalAxis>

    <telerikChart:LineSeries>
        <telerikChart:LineSeries.CategoryBinding>
            <telerikChart:PropertyNameDataPointBinding PropertyName="Category"/>
        </telerikChart:LineSeries.CategoryBinding>
        <telerikChart:LineSeries.ValueBinding>
            <telerikChart:PropertyNameDataPointBinding PropertyName="Value"/>
        </telerikChart:LineSeries.ValueBinding>

        <telerikChart:ChartTrackBallBehavior.TrackInfoTemplate>
            <DataTemplate>
                <StackPanel>
                    <TextBlock Text="{Binding DataPoint.DataItem.Info}" Margin="5" Foreground="DarkSalmon"/>
                </StackPanel>
            </DataTemplate>
        </telerikChart:ChartTrackBallBehavior.TrackInfoTemplate>

        <telerikChart:ChartTrackBallBehavior.IntersectionTemplate>
            <DataTemplate>
                <Ellipse Width="10" Height="10" Fill="Tomato"/>
            </DataTemplate>
        </telerikChart:ChartTrackBallBehavior.IntersectionTemplate>

    </telerikChart:LineSeries>

    <telerikChart:RadCartesianChart.Behaviors>
        <telerikChart:ChartTrackBallBehavior InfoMode="Multiple" ShowIntersectionPoints="True">

            <telerikChart:ChartTrackBallBehavior.LineStyle>
                <Style TargetType="Polyline">
                    <Setter Property="Stroke" Value="Tomato"/>
                    <Setter Property="StrokeThickness" Value="2"/>
                    <Setter Property="StrokeDashArray" Value="1,2"/>
                </Style>
            </telerikChart:ChartTrackBallBehavior.LineStyle>

            <telerikChart:ChartTrackBallBehavior.InfoStyle>
                <Style TargetType="telerikChartPrimitives:TrackBallInfoControl">
                    <Setter Property="Background" Value="White"/>
                </Style>
            </telerikChart:ChartTrackBallBehavior.InfoStyle>

        </telerikChart:ChartTrackBallBehavior>
    </telerikChart:RadCartesianChart.Behaviors>
</telerikChart:RadCartesianChart>
We will also need the following namespaces:
xmlns:telerikChart="using:Telerik.UI.Xaml.Controls.Chart"
xmlns:telerikChartPrimitives="using:Telerik.UI.Xaml.Controls.Chart.Primitives"
Here we set the ItemsSource of the chart to a collection of Data items.
chart.Series[0].ItemsSource = new ObservableCollection<Data>
{
    new Data { Value = 10, Category = "car", Info = "car info" },
    new Data { Value = 7, Category = "bus", Info = "bus info" },
    new Data { Value = 6, Category = "train", Info = "train info" },
    new Data { Value = 4, Category = "airplane", Info = "airplane info" }
};
You can see that in the TrackInfoTemplate we can access the DataPoint and the underlying DataItem as well.
Here is the result.