Analysis & Reports
- What is burndown?
- Where do I look for the burndown?
- When do I need to check my burndown?
- What is velocity? How do I track my team's velocity?
- Do we plan properly? Are we too optimistic? Do we deliver what we've intended during the planning?
FAQ: Analysis & Reports
What is burndown?
Burndown is a graphical chart showing the progress of completing work over time. It also shows a forecast of when the estimated work will be completed. It`s calculated based on the amount of work done up till this moment. You can read more about burndown charts and their usage (wikipedia).
Here is an example:
![]()
Burndown chart in TeamPulse.
As a graphical representation of work remaining over time, the burndowns in TeamPulse show the rate that work is being completed in an iteration. There are two lines on the graph which show the actual work completed and a forecast. The actual trend is used to calculate the information shown in the Estimated Completion and Late Items columns in the “Iteration Status” report.
There are additional options at the top of the chart: Actual, Forecast, Added/Removed, Done. By default they are all visible. Clicking on them shows/hides the corresponding information from the chart.
- Actual – shows line of the actual work done from the start of the iteration
- Forecast – draws forecast of the future work, based on the velocity from the start of the iteration
- Done – shows how much work was done during the corresponding period
- Added / Removed - shows how much work was added/removed during the corresponding period
- When work is added – it is drawn on the positive side of the coordinate system
- When work is removed – it is drawn on the negative side of the coordinate system
The burndown is calculated using the burndown mode chosen for the project. The default burndown mode is by task estimate but you can also use estimate (based on stories, bugs, issues and risks in the iteration), task count, and task work remaining. You can change the default burndown mode used by a project from Settings >> Projects (pick one) >> Reporting Settings.
Choosing which type of burndown you'll use depends on how much data you'll track inside TeamPulse. Many teams will only need to track story level progress. Others will need the early feedback of the work completed burndown but also will need to track more data in TeamPulse for it to work. There are 4 types in TeamPulse:
- by story estimate - every time you complete a story the burndown chart will be updated and the story estimate will be deducted from the total sum of all stories estimate. The chart is generated dinamicly and shows how much work (in estimate) you have left each day
- by task count - this burndown will be updated every time you complete a task. It only takes into account the number of tasks you have and not their estimation. This is useful when you need more granular and frequently updated info about the progress of your work (assuming that your stories are decomposed into several tasks and these tasks get completed gradually before you complete the whole story itself)
- by tasks estimate - the difference with the burndown by task count is that it takes into account how big each task is and thus provides you with more accurate data about how much of the work is done (it takes into consideration only tasks with “done” status). Because completing a task estimated as 10 hours is not the same as completing a 0.5 hours task
- by tasks work remaining – it is fed by the values entered in “task work remaining field” which is manually updated i.e. it is not dependent on the value logged for time spent working on the task. Note that in practice the values indicated in remaining work fields are often inaccurate, either because they are not entered, out of date, or simply very difficult to gauge. Many of the members of our teams for example have witnessed on past projects the classic "90% Complete" phenomenon where a task is reported as being 90% complete but takes ages to ever reach 100%
For example if a task is estimated to 5 hours and afterwards 2 hours are spent working on it, the work remaining value will not be 3. This is done because not always the work remaining value is a decrement of the original estimation. The work remaining field needs to be rather manually updated and that's why sometimes the burndowns may seem odd.
For example a task may be estimated to 5 hours but all of a sudden, it becomes clear that the time necessary to complete it may be 9 hours. So instead of changing the original estimate, it is better to update the work remaining field, so that the managers get a full understanding of the project health.
Where do I look for the burndown?
If you are looking for a burndown for the current iteration:
- go to Analyze -> Iteration Status
- expand the details for the desired iteration
You'll see something like this:

If you want to see the burndown for past iteration(s):
- go to Analysis -> Reports
- pick Burndown, Burndown by Area, or the Burndown by Tasks reports.
When do I need to check my burndown?
In the beginning of the iteration it won't be useful as you are just starting your work there is no enough data to generate a meaningful burndown. Later in the iteration you will start to see the actual trend and the prediction of when all the work will be finished.
So it is most useful to look at the burndown in the middle of the iteration when you've already done some work but still have to adapt if the predictions for the iteration are not good.
Looking at the burndown at the end or after the end of the iteration can help you analyze how work is spread over the iteration. The ideal option is for the work to be spread evenly throughout the iteration without the stress of "OMG! The iteration is ending we need to work overtime to do everything on time".
What is velocity? How do I track my team's velocity?
Velocity is the average measure of how much you've completed for a given iteration.
For example, if in an iteration you've completed estimated work of 80 your velocity for that iteration is 80.
The velocity gets useful when you track it over the course of several iterations. Then you can compute what is your average velocity. This will help you when you are planning your next iterations.
For example, if your last 3 iterations had velocities of 50, 30 and 40 your average velocity will be 40. So when you plan your 4th iteration you'll know to plan work only estimated as totally 40. (in this example you were overly optimistic in the first iteration getting too much work, then in the second - too pessimistic and got way less work and on the third iteration - you were ok.)
You can see your teams velocity for a project:
- go to Analyze -> Reports
- then choose Velocity report
- pick the iterations you want to see - Clicking on the Past option at the top should work, but picking individual iterations will also work.

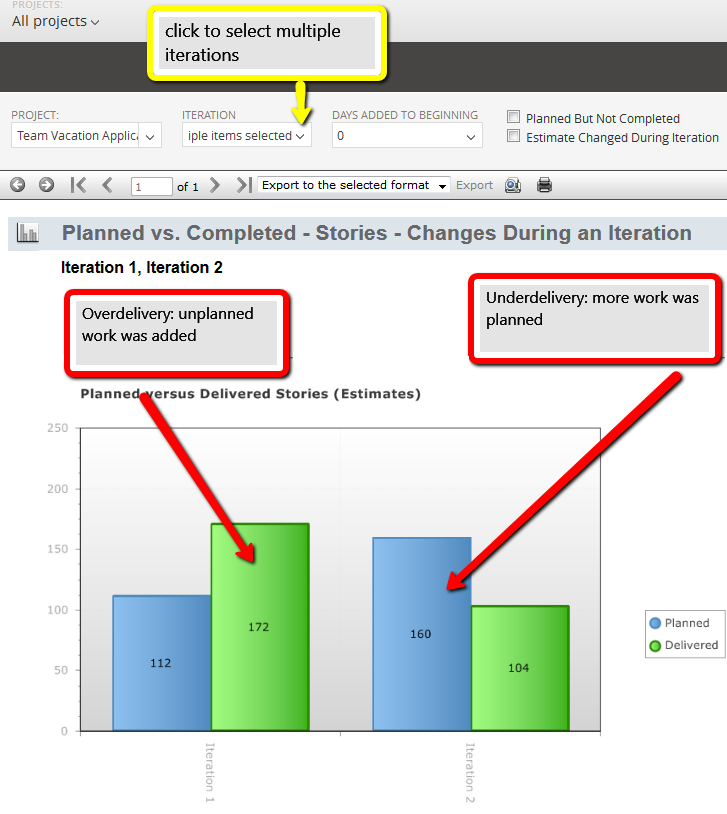
Do we plan properly? Are we too optimistic? Do we deliver what we've intended during the planning?
(Go to Analyze > Reports > Planning Report Types > Velocity) (Go to Analyze > Reports > Requirements Report Types >> Estimate vs. Actual) Note: Only completed stories and their completed tasks are included in the report. (Go to Analyze > Reports > Planning Report Types >> Velocity) The vertical axis represents the total estimate for the work items, while the horizontal one shows the respective iteration.Measure Velocity to See How Much Work You Can Complete Per Iteration
If there was one word to describe optimal iteration velocity – that would be “stable”. A sudden drop or increase of velocity might indicate issues in planning. The velocity report in TeamPulse indicates stories and bugs completion over time. The vertical axis represents total sum of the estimates, while the horizontal one shows the iteration/s.

Cross-reference Forecast with the Real Delivery
Completing all corresponding tasks is a key element to a successful story delivery. You can regulate task estimation as opposed to the actual work completed after utilizing this report.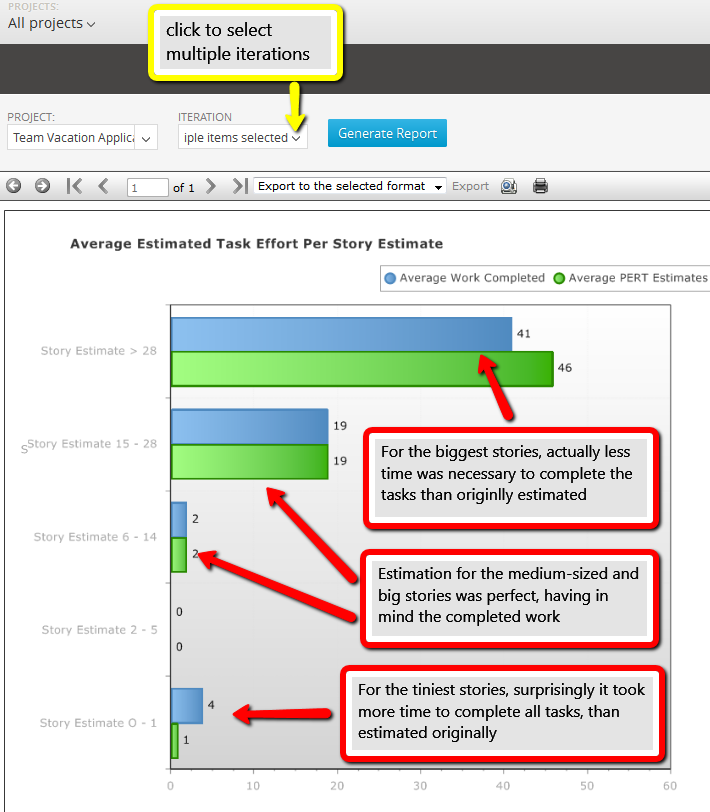
Analyze if Iteration Capacity is Properly Planned
Provided an iteration capacity is one set, the sum of the planned work (at the beginning of the iteration) should be equal in the ideal case to the sum of the delivered work (at the end of the iteration). Any discrepancy leads to over-commitment (work items added after the start of the iteration) or under-delivery.