Creating Maps
You can create a Kendo UI Map from scratch by using freely available map datasets.
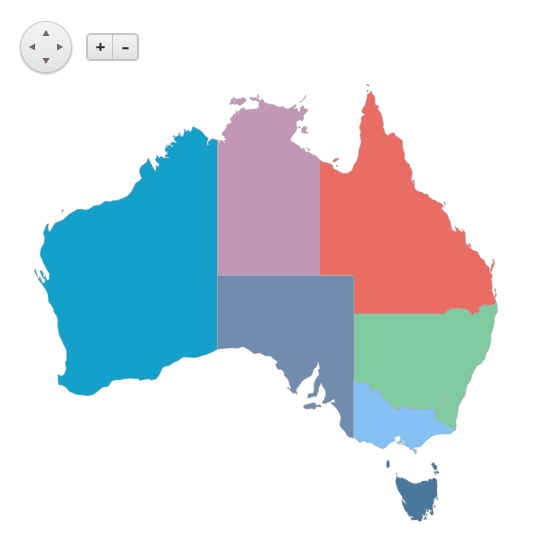
The following examples demonstrate how to construct a map of the Australian states and mainland territories:
The following image demonstrates the expected map.
Locating an External Map Dataset
To locate a map dataset that matches your requirements, use an official source for map data such as the U.S. Census Bureau and Ordnance Survey.
The current map project of the Australian states and mainland territories uses data from the Natural Earth project. Natural Earth datasets cover the public domain and the project is supported by NACIS. It offers different data themes in the 1:10m, 1:50m, and 1:110m levels of detail. The current map project and examples use the Admin 1 – States, provinces dataset. A scale of 1:50 000 000 provides a good detail/size balance on a country level. The dataset is available for download in Esri Shapefile format. For more information, refer to the website on global administrative areas.
Exploring the Data
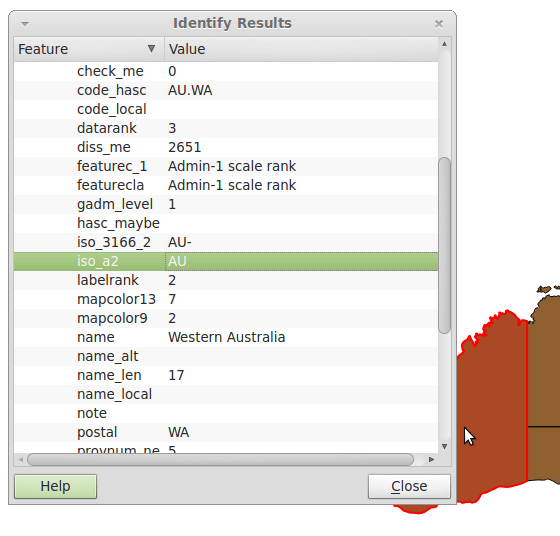
To explore new map datasets, use a traditional desktop geographic information system (GIS) application, for example, the open-source QGIS project. Import the Esri Shapefile for the data and by using the Identify tool, inspect the available metadata. For the purpose of this project, you can narrow down your interest in features with the "AU" ISO 3166-1 alpha-2 country code.
Processing the Data
You need to extract the data for the target region and process it in a usable format for the Map component by converting it to GeoJSON. To convert between different vector formats, you can use the OGR Library and utilities project which is part of the Geospatial Data Abstraction Library and which includes the ogr2ogr command-line tool. As an alternative, you can also use the Mapshaper tool that allows you to do many edits directly in the browser.
The following example demonstrates how to convert the dataset to GeoJSON and filter it out. As a result, your dataset is ready and can be displayed.
ogr2ogr -f GeoJSON -where "iso_a2 = 'AU'" au-states.json ne_50m_admin_1_states_provinces_lakes.shp
Loading the Data
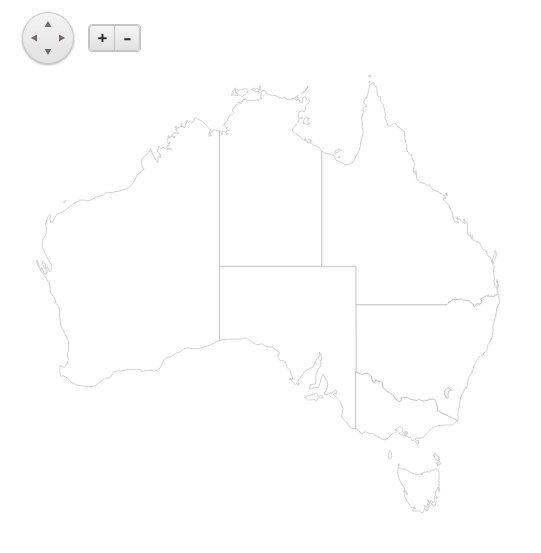
The following example demonstrates how to set up a simple Map component and add a single shape layer to it. The GeoJSON data source will point to your processed dataset.
Make sure the GeoJSON files are properly encoded, preferably in UTF-8.
<div id="map" style="width: 600px; height: 600px;"></div>
<script>
$("#map").kendoMap({
    center: [-28.0000, 136.2500],
    zoom: 4,
    layers: [{
        type: "shape",
        dataSource: {
            type: "geojson",
            transport: {
                read: "./au-states.json"
            }
        }
    }]
});
</script>
Adding the Styles
The following example demonstrates how to define a palette and apply it based on the desired province. The provnum_ne field goes from 1 to 9 which denotes each mainland state and territory. To set the fill color of the newly created shape, this project uses the shapeCreated event.
<div id="map" style="width: 600px; height: 600px;"></div>
<script>
var colors = ["#E96D63", "#7FCA9F", "#F4BA70", "#85C1F5", "#4A789C", "#13A1CB", "#728CB0", "#C296B6"];

$("#map").kendoMap({
    center: [-28.0000, 136.2500],
    zoom: 4,
    layers: [{
        type: "shape",
        dataSource: {
            type: "geojson",
            transport: {
                read: "./au-states.json"
            }
        }
    }],
    shapeCreated: function(e) {
        var provNum = e.shape.dataItem.properties["provnum_ne"];
        if (provNum) {
            e.shape.fill(colors[provNum % colors.length]);
        }
    }
});
</script>