Pie Charts
Pie Charts display data as single-series sectors from a two-dimensional circle which is useful for rendering data as a part of the whole.
Getting Started
The Kendo UI Donut Chart is a Pie Chart variation with the same ability to display a single data series in a two-dimensional circle and is likewise useful for displaying data as a part of the whole.
To create a Pie series in the Chart HtmlHelper, use Pie in the Series configuration.
Creating the Pie Chart
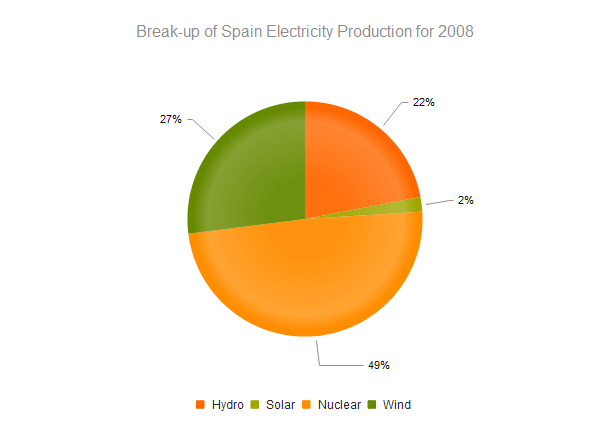
The following example demonstrates how to define a single series of type "pie". Additional series are not supported and each data point is an object that specifies the point value, category label, and other properties.
$("#chart").kendoChart({
    title: {
        text: "Break-up of Spain Electricity Production for 2008"
    },
    legend: {
        position: "bottom"
    },
    seriesDefaults: {
        labels: {
            visible: true,
            format: "{0}%"
        }
    },
    series: [{
        type: "pie",
        data: [ {
            category: "Hydro",
            value: 22
        }, {
            category: "Solar",
            value: 2
        }, {
            category: "Nuclear",
            value: 49
        }, {
            category: "Wind",
            value: 27
        } ]
    }]
});
Auto-Fit Labels
Use the Series autoFit option to avoid clipping of the labels' content.
    <div id="chart" style="width: 200px;"></div>
    <script>
    var data = [{
      kind: 'Solar', share: 0.052
    }, {
      kind: 'Wind', share: 0.225
    }, {
      kind: 'Other', share: 0.192
    }, {
      kind: 'Hydroelectric', share: 0.175
    }, {
      kind: 'Nuclear', share: 0.238
    }, {
      kind: 'Coal', share: 0.118
    }];

    $("#chart").kendoChart({
      dataSource: { data: data },
      series: [{
          type: "pie",
          field: "share",
          categoryField: "kind",
          autoFit: true,
          labels: {
            color: "#000",
            position: "outsideEnd",
            template: "#: category #",
            visible: true
          }
      }],
      legend: {
        visible: false
      }
    });
    </script>
Configuring the Effects Overlay
Each segment has a transparent effect overlay that adds depth to the two-dimensional shape. The overlay transparent gradient is configurable.
$("#chart").kendoChart({
    series: [{
        type: "pie",
        overlay: {
            gradient: "none"
        }
    }]
});
The Pie Chart supports the following gradient options:
-
(Default)
roundedBevel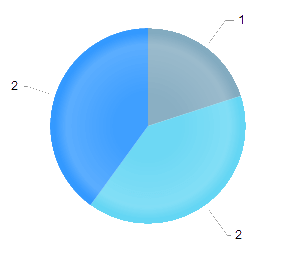
-
sharpBevel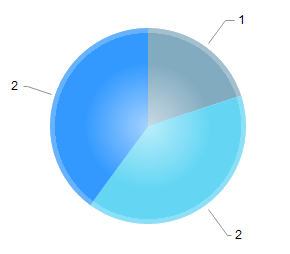
-
none