ChartView for Xamarin.Android: Annotations
In this article, you will learn to use the annotations feature in RadChartView for Xamarin.Android and also how to create custom annotations.
Overview
Annotations are visual elements used to highlight certain areas on the plot. They can be used as comments or as markers for specific values on the plot. You can practically use any visual element as template for the annotation.
RadChartView provides support for the following types of annotations:
- GridLineAnnotations: this annotation is visually represented by straight lines across the chart that marks a specific value on the associated Cartesian axis.
- PlotBandAnnotations: this annotation is visually represented by a band across the chart that marks a specific range on the associated Cartesian axis.
- CustomAnnotations: this annotation marks a specific point on the Cartesian chart. It requires both horizontal and vertical coordinates to be specified.
You can read from the Bar Series page how to create a simple chart with BarSeries which we will now extend to include annotations.
Grid Line Annotations
The GridLineAnnotation represents a vertical or horizontal line that crosses the entire plot area.
Here is an example that demonstrates how to define a vertical CartesianGridLineAnnotation in the chart that we have created. In the constructor of the annotation you need to specify the axis that will be annotated and the value which determines the position.
CartesianGridLineAnnotation annotation = new CartesianGridLineAnnotation(verticalAxis, 8);

chartView.Annotations.Add(annotation);
annotation.StrokeColor = Color.Green;
annotation.StrokeWidth = 4;
Here's the result:

You can modify the width and the color of the annotation with the StrokeWidth and StrokeColor properties of the annotation as shown in the example.
Optionally you can also provide a PathEffect that will be used for the line that is drawn by using the StrokeEffect property. For example if you want to have a dashed line, instead of solid, you can use the following approach:
annotation.StrokeEffect = new DashPathEffect (new float[] { 20, 10 }, 0);
Plot Band Annotations
The PlotBandAnnotation represents a vertical or horizontal area that crosses the entire plot area.
Here is an example that demonstrates how to define a vertical CartesianPlotBandAnnotation in the chart that we have created. In the constructor of the annotation you need to specify the axis that will be annotated and the two values that will determine the range for the annotation.
CartesianPlotBandAnnotation annotation = new CartesianPlotBandAnnotation(verticalAxis, 6, 8);

chartView.Annotations.Add(annotation);
annotation.FillColor = Color.Green;
annotation.StrokeColor = Color.Cyan;
annotation.StrokeWidth = 4;
Here's the result:

You can modify the fill of the annotation as well as the width and the color of its stroke with the methods FillColor, StrokeWidth and StrokeColor properties as shown in the example.
Additionally, you can also provide a PathEffect that will be used for the line that is drawn by using the StrokeEffect property.
Custom Annotations
The CustomAnnotation provides a way to draw custom annotations. In the constructor of the annotation you need to specify both vertical and horizontal axes as well as values for both of them. They will be used to determine the position for the annotation.
Here's the constructor for CartesianCustomAnnotation to better prepare you for using it.
//API Reference
public CartesianCustomAnnotation(
    CartesianAxis p0, // Vertical Axis
    CartesianAxis p1, // Horizontal Axis
    Java.Lang.Object p2, // Annotation vertical axis value
    Java.Lang.Object p3, // Annotation horizontal axis value
    Java.Lang.Object p4 // Annotation content value
    )
When the axis is numerical (Linear or Logarithmic) a numeric value is expected, and when it is categorical - a category is expected.
You also need to set the content for the annotation, which can be text or something more complex like a Bitmap. Let's explore both of those possibilities.
Custom Text Annotation
Here's an example which adds a text annotation to a specific position in the chart that we have created.
var annotationValue = 6;
var annotationCategory = "Feb";
var annotationContent = "TARGET";

var annotation = new CartesianCustomAnnotation(
    verticalAxis,
    horizontalAxis,
    annotationValue,
    annotationCategory,
    annotationContent);

chartView.Annotations.Add(annotation);
Now the annotation will be the text TARGET and it will be drawn where the vertical axis has value 6 and the horizontal axis has value Feb. Additionally, you can provide a custom renderer for the annotation with the property ContentRenderer. The custom renderer must implement the interface CustomAnnotationRenderer.
Here is an example for such a renderer which draws a text annotation with custom style:
using Android.Graphics;
using Com.Telerik.Android.Common.Math;
using Com.Telerik.Widget.Chart.Engine.Decorations.Annotations.Custom;

public class CustomTextRenderer : Java.Lang.Object, ICustomAnnotationRenderer
{
    private readonly Paint contentPaint = new Paint();

    public CustomTextRenderer()
    {
        contentPaint.TextSize = 36;
        contentPaint.Color = Color.Red;
        contentPaint.SetTypeface(Typeface.Create("sans-serif-light", TypefaceStyle.Normal));
    }

    public RadSize MeasureContent(Java.Lang.Object content)
    {
        if (content == null)
        {
            return RadSize.Empty;
        }

        var text = content.ToString();
        var textBounds = new Rect();

        contentPaint.GetTextBounds(text, 0, text.Length, textBounds);

        return new RadSize(textBounds.Width(), textBounds.Height());
    }

    public void Render(
        Java.Lang.Object content,
        RadRect layoutSlot,
        Canvas canvas,
        Paint paint)
    {

        if (content == null)
        {
            return;
        }

        var text = content.ToString();

        canvas.DrawText(
            text,
            (float)layoutSlot.GetX() - (float)(layoutSlot.Width / 2.0),
            (float)layoutSlot.Bottom - (float)layoutSlot.Height / 2,
            contentPaint);
    }
}
Now, use a new instance of the CustomTextRenderer with the CartesianCustomAnnotation ContentRenderer property.
var annotationValue = 6;
var annotationCategory = "Feb";
var annotationContent = "TARGET";

var annotation = new CartesianCustomAnnotation(
    verticalAxis,
    horizontalAxis,
    annotationValue,
    annotationCategory,
    annotationContent);

// Now you can set the ContentRenderer to a new instance of the custom text renderer
annotation.ContentRenderer = new CustomTextRenderer();

chartView.Annotations.Add(annotation);
Here's the result:

Custom Image Annotation
You can use the same code we just used for the Text annotation. However, this time we'll use a Bitmap instead of a string for the content.
using Android.Graphics;
using Com.Telerik.Android.Common.Math;
using Com.Telerik.Widget.Chart.Engine.Decorations.Annotations.Custom;

public class ImageAnnotationRenderer : Java.Lang.Object, ICustomAnnotationRenderer
{
    public RadSize MeasureContent(Java.Lang.Object content)
    {
        if (content == null)
        {
            return RadSize.Empty;
        }

        // Cast the content as Bitmap
        var imgBitmap = (Bitmap)content;

        // Get the bitmap dimensions to measure the size of the contents.
        return new RadSize(imgBitmap.Width, imgBitmap.Height);
    }

    public void Render(
        Java.Lang.Object content,
        RadRect layoutSlot,
        Canvas canvas,
        Paint paint)
    {
        if (content == null)
        {
            return;
        }

        // Cast the content as Bitmap
        var imgBitmap = (Bitmap)content;

        // Draw the bitmap to the Canvas
        canvas.DrawBitmap(
            imgBitmap,
            (float)layoutSlot.GetX() - (float)(layoutSlot.Width / 2.0),
            (float)layoutSlot.Bottom - (float)layoutSlot.Height / 2,
            paint);

    }
}
Notice in the Render method, you are given a
Canvasparameter? This is what you are drawing the custom content to. You can use any of the Android Canvas's features, such asDrawBitmap.
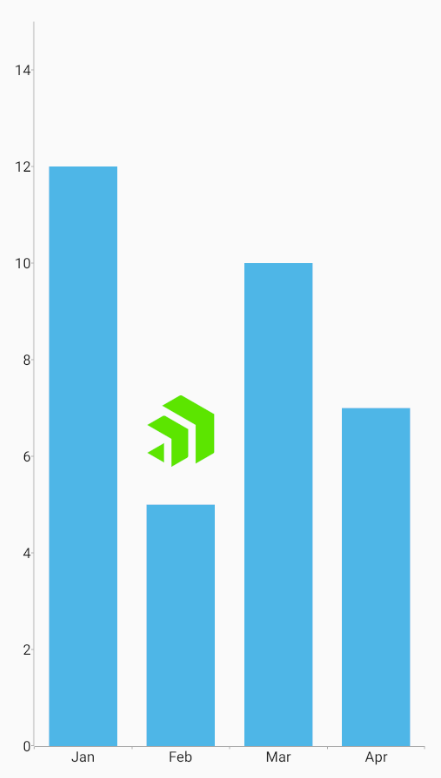
To use it, pass it a valid Bitmap object to the CartesianCustomAnnotation and set the ContentRender to a new instance of custom ImageAnnotationRenderer class.
Bitmap myImage = GetImage();

// Use a Bitmap for the content parameter
var annotation = new CartesianCustomAnnotation(
    chartView.VerticalAxis,
    chartView.HorizontalAxis,
    8,
    "Feb",
    myImage);

// Set the ContentRenderer to the new one that can draw the bitmap to the canvas
annotation.ContentRenderer = new ImageAnnotationRenderer();

chartView.Annotations.Add(annotation);
Here's the result at runtime: