Spline Series
Overview
RadCartesianChart visualizes each data item from the LineSeries and connects them with curved line segments. The SplineSeries extend LineSeries, so they are also CategoricalSeries and require one CategoricalAxis and one NumricalAxis.
Features
SplineSeries extend LineSeries so they provide the same properties to change their style:
- Stroke (Color): changes the color used to draw lines.
- StrokeThickness (double): changes the width of the lines.
Example
Here is an example how to create RadCartesianChart with Spline Series:
First, create the needed business objects, for example:
public class CategoricalData
{
    public object Category { get; set; }

    public double Value { get; set; }
}
Then create a ViewModel:
public class CategoricalDataViewModel
{
    public ObservableCollection<CategoricalData> Data { get; set; }

    public CategoricalDataViewModel()
    {
        this.Data = GetCategoricalData();
    }

    private static ObservableCollection<CategoricalData> GetCategoricalData()
    {
        var data = new ObservableCollection<CategoricalData>
        {
            new CategoricalData { Category = "A", Value = 101 },
            new CategoricalData { Category = "B", Value = 45 },
            new CategoricalData { Category = "C", Value = 77 },
            new CategoricalData { Category = "D", Value = 15 },
            new CategoricalData { Category = "E", Value = 56 },
        };
        return data;
    }
}
Finally, use the following snippet to declare a RadCartesianChart with Spline Series in XAML and in C#:
<telerikChart:RadCartesianChart>
    <telerikChart:RadCartesianChart.BindingContext>
        <local:CategoricalDataViewModel />
    </telerikChart:RadCartesianChart.BindingContext>
    <telerikChart:RadCartesianChart.HorizontalAxis>
        <telerikChart:CategoricalAxis LabelFitMode="MultiLine"
                                      PlotMode="OnTicks" />
    </telerikChart:RadCartesianChart.HorizontalAxis>
    <telerikChart:RadCartesianChart.VerticalAxis>
        <telerikChart:NumericalAxis />
    </telerikChart:RadCartesianChart.VerticalAxis>
    <telerikChart:RadCartesianChart.Series>
        <telerikChart:SplineSeries ValueBinding="Value"
                                   CategoryBinding="Category"
                                   ItemsSource="{Binding Data}" />
    </telerikChart:RadCartesianChart.Series>
</telerikChart:RadCartesianChart>
var chart = new RadCartesianChart
{
    BindingContext = new CategoricalDataViewModel(),
    HorizontalAxis = new CategoricalAxis()
    {
        LabelFitMode = AxisLabelFitMode.MultiLine,
        PlotMode = AxisPlotMode.OnTicks
    },
    VerticalAxis = new NumericalAxis(),
    Series =
    {
        new SplineSeries
        {
            ValueBinding = new PropertyNameDataPointBinding("Value"),
            CategoryBinding = new PropertyNameDataPointBinding("Category")
        }
    }
};

chart.Series[0].SetBinding(ChartSeries.ItemsSourceProperty, "Data");
Where the telerikChart namespace is the following:
xmlns:telerikChart="clr-namespace:Telerik.XamarinForms.Chart;assembly=Telerik.XamarinForms.Chart"
using Telerik.XamarinForms.Chart;
And here is the result:
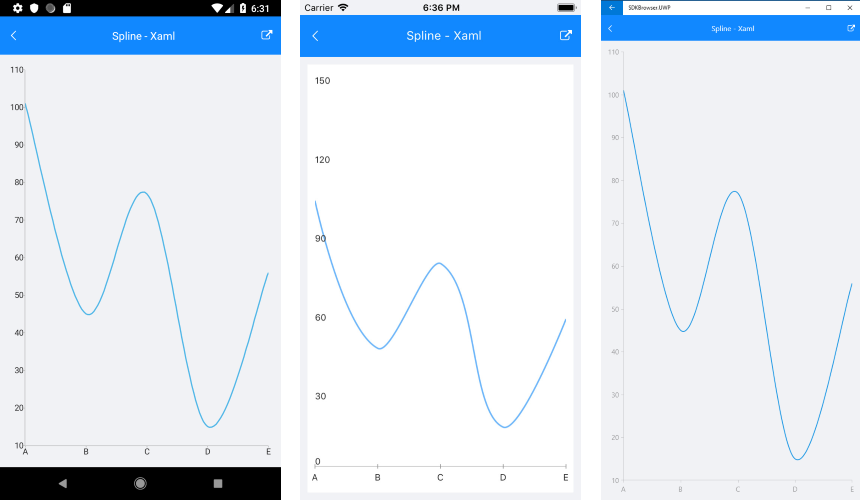
A sample Spline Series example can be found in the Chart/Series folder of the SDK Samples Browser application.
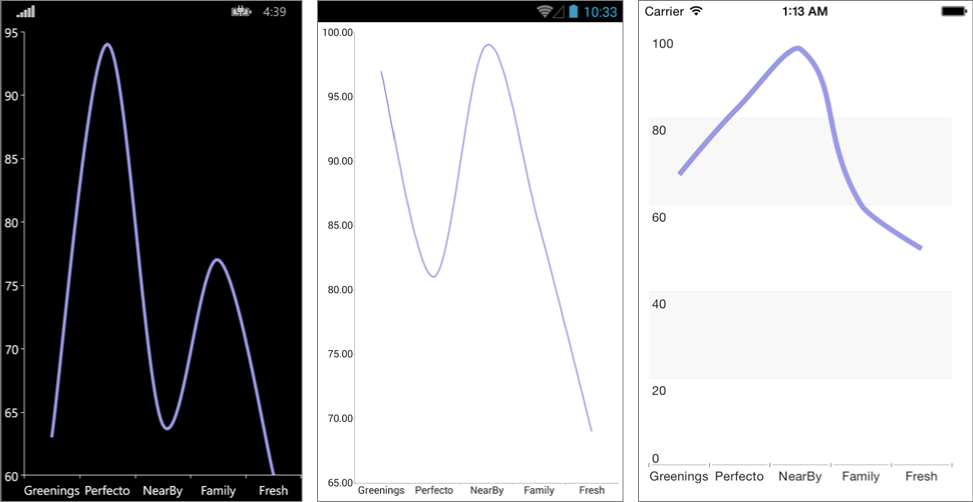
Customization Example
Here we make some customization:
    var series = new SplineSeries
    {
        Stroke = new Color(0.6, 0.6, 0.9),
        StrokeThickness = 5
    };