ScatterAreaSeries
Overview
RadCartesianChart visualizes ScatterAreaSeries as the area enclosed by the coordinate axes and straight line segments that connect the series data points. The ScatterAreaSeries inherit from the ScatterPointSeries class and also require both axes of the chart to be of type NumericalAxis.
Features
ScatterAreaSeries provides the following properties to change its style:
- Stroke (Color): Changes the color used to draw lines.
- StrokeThickness (double): Changes the width of the lines.
- Fill (Color): Changes the color of the chart area.
Example
Here is an example how to create RadCartesianChart with ScatterArea Series:
First, create the needed business objects, for example:
public class NumericalData
{
    public double XData { get; set; }
    public double YData { get; set; }
}
Then create a ViewModel:
public class NumericalViewModel
{
    public ObservableCollection<NumericalData> Data { get; set; }

    public NumericalViewModel()
    {
        this.Data = GetNumericData();
    }

    public static ObservableCollection<NumericalData> GetNumericData()
    {
        var data = new ObservableCollection<NumericalData>
        {
            new NumericalData { XData = 4, YData = 9 },
            new NumericalData { XData = 8, YData = 10 },
            new NumericalData { XData = 9, YData = 13 },
            new NumericalData { XData = 12, YData = 24 },
            new NumericalData { XData = 17, YData = 24 },
            new NumericalData { XData = 21, YData = 4 },
            new NumericalData { XData = 26, YData = 13 },
            new NumericalData { XData = 29, YData = 3 },
            new NumericalData { XData = 30, YData = 16 },
        };
        return data;
    }
}
Finally, use the following snippet to declare a RadCartesianChart with ScatterArea Series in XAML and in C#:
<telerikChart:RadCartesianChart>
    <telerikChart:RadCartesianChart.BindingContext>
        <local:NumericalViewModel />
    </telerikChart:RadCartesianChart.BindingContext>
    <telerikChart:RadCartesianChart.HorizontalAxis>
        <telerikChart:NumericalAxis LabelFitMode="MultiLine" />
    </telerikChart:RadCartesianChart.HorizontalAxis>
    <telerikChart:RadCartesianChart.VerticalAxis>
        <telerikChart:NumericalAxis />
    </telerikChart:RadCartesianChart.VerticalAxis>
    <telerikChart:RadCartesianChart.Series>
        <telerikChart:ScatterAreaSeries XValueBinding="XData"
                                        YValueBinding="YData"
                                        ItemsSource="{Binding Data}" />
    </telerikChart:RadCartesianChart.Series>
</telerikChart:RadCartesianChart>
var chart = new RadCartesianChart
{
    BindingContext = new NumericalViewModel(),
    HorizontalAxis = new NumericalAxis()
    {
        LabelFitMode = AxisLabelFitMode.MultiLine
    },
    VerticalAxis = new NumericalAxis(),
    Series =
    {
        new ScatterAreaSeries
        {
            XValueBinding = new PropertyNameDataPointBinding("XData"),
            YValueBinding = new PropertyNameDataPointBinding("YData")
        }
    }
};

chart.Series[0].SetBinding(ChartSeries.ItemsSourceProperty, "Data");
Where the telerikChart namespace is the following:
xmlns:telerikChart="clr-namespace:Telerik.XamarinForms.Chart;assembly=Telerik.XamarinForms.Chart"
using Telerik.XamarinForms.Chart;
And here is the result:
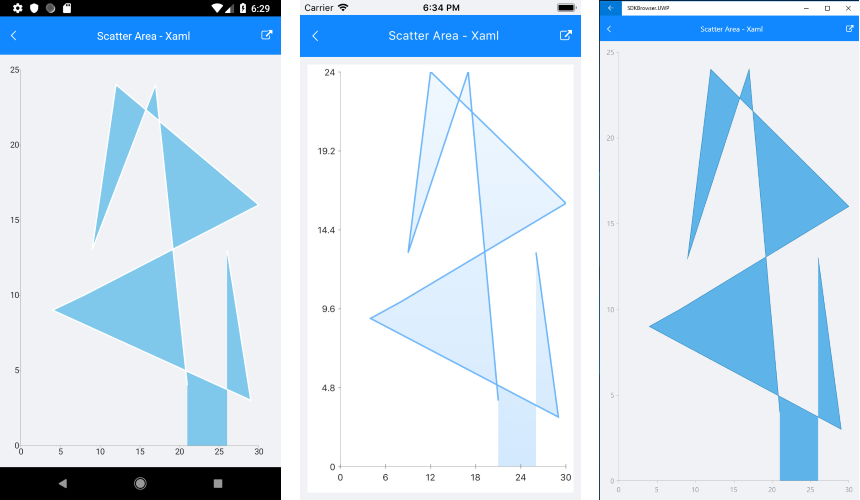
A sample ScatterArea Series example can be found in the Chart/Series folder of the SDK Samples Browser application.
Customization Example
Here we make some customization:
    var series = new ScatterAreaSeries
    {
        Stroke = new Color(0.6, 0.6, 0.9),
        StrokeThickness = 5,
        Fill = new Color(0.8, 0.8, 1)
    };