Combine Mode
When the series in a RadCartesianChart are more than one, a few different drawing strategies can be used. The possible strategies are:
- None: The series are not combined - each series is plotted independently.
- Cluster: Series are combined next to each other (applicable for BarSeries).
- Stack: Series form stacks.
- Stack100: Series form stacks that occupy 100% of the plot area and the characterictic size of each series is proportional to its relative value.
The default combine mode is None. You can define the current combine mode with the series CombineMode property.
CombineMode could be applied only to Categorical Series, such as Bar, Line and Area.
Stack Bar Series Example
Here is an example how to create Stack CartesianChart with Bar Series :
First, create the needed business objects, for example:
public class CategoricalData
{
    public object Category { get; set; }

    public double Value { get; set; }
}
Then create a ViewModel:
public class SeriesCategoricalViewModel
{
    public ObservableCollection<CategoricalData> Data1 { get; set; }
    public ObservableCollection<CategoricalData> Data2 { get; set; }

    public SeriesCategoricalViewModel()
    {
        this.Data1 = GetCategoricalData1();
        this.Data2 = GetCategoricalData2();
    }

    private static ObservableCollection<CategoricalData> GetCategoricalData1()
    {
        var data = new ObservableCollection<CategoricalData>
        {
            new CategoricalData { Category = "Greenings", Value = 52 },
            new CategoricalData { Category = "Perfecto", Value = 19 },
            new CategoricalData { Category = "NearBy", Value = 82 },
            new CategoricalData { Category = "Family", Value = 23 },
            new CategoricalData { Category = "Fresh", Value = 56 },
        };
        return data;
    }

    private static ObservableCollection<CategoricalData> GetCategoricalData2()
    {
        var data = new ObservableCollection<CategoricalData>
        {
            new CategoricalData { Category = "Greenings", Value = 33 },
            new CategoricalData { Category = "Perfecto", Value = 51 },
            new CategoricalData { Category = "NearBy", Value = 11 },
            new CategoricalData { Category = "Family", Value = 94 },
            new CategoricalData { Category = "Fresh", Value = 12 },
        };
        return data;
    }
}
Finally, use the following snippet to declare a CombineMode property to the Bar Series in XAML and in C#:
<telerikChart:RadCartesianChart>
    <telerikChart:RadCartesianChart.BindingContext>
        <local:SeriesCategoricalViewModel />
    </telerikChart:RadCartesianChart.BindingContext>
    <telerikChart:RadCartesianChart.HorizontalAxis>
        <telerikChart:CategoricalAxis LabelFitMode="MultiLine" />
    </telerikChart:RadCartesianChart.HorizontalAxis>
    <telerikChart:RadCartesianChart.VerticalAxis>
        <telerikChart:NumericalAxis LabelFitMode="MultiLine" />
    </telerikChart:RadCartesianChart.VerticalAxis>
    <telerikChart:RadCartesianChart.Series>
        <telerikChart:BarSeries ValueBinding="Value"
                                CategoryBinding="Category"
                                CombineMode="Stack"
                                ItemsSource="{Binding Data1}" />
        <telerikChart:BarSeries ValueBinding="Value"
                                CategoryBinding="Category"
                                CombineMode="Stack"
                                ItemsSource="{Binding Data2}" />
    </telerikChart:RadCartesianChart.Series>
</telerikChart:RadCartesianChart>
var chart = new RadCartesianChart
{
    BindingContext = new SeriesCategoricalViewModel(),
    HorizontalAxis = new CategoricalAxis()
    {
        LabelFitMode = AxisLabelFitMode.MultiLine,
    },
    VerticalAxis = new NumericalAxis()
    {
        LabelFitMode = AxisLabelFitMode.MultiLine,
    },
    Series =
    {
        new BarSeries
        {
            ValueBinding = new PropertyNameDataPointBinding("Value"),
            CategoryBinding = new PropertyNameDataPointBinding("Category"),
            CombineMode = ChartSeriesCombineMode.Stack
        },
        new BarSeries
        {
            ValueBinding = new PropertyNameDataPointBinding("Value"),
            CategoryBinding = new PropertyNameDataPointBinding("Category"),
            CombineMode = ChartSeriesCombineMode.Stack
        }
    }
};

chart.Series[0].SetBinding(ChartSeries.ItemsSourceProperty, "Data1");
chart.Series[1].SetBinding(ChartSeries.ItemsSourceProperty, "Data2");
Where the telerikChart namespace is the following:
xmlns:telerikChart="clr-namespace:Telerik.XamarinForms.Chart;assembly=Telerik.XamarinForms.Chart"
using Telerik.XamarinForms.Chart;
Here is how Stack Bar Series looks:
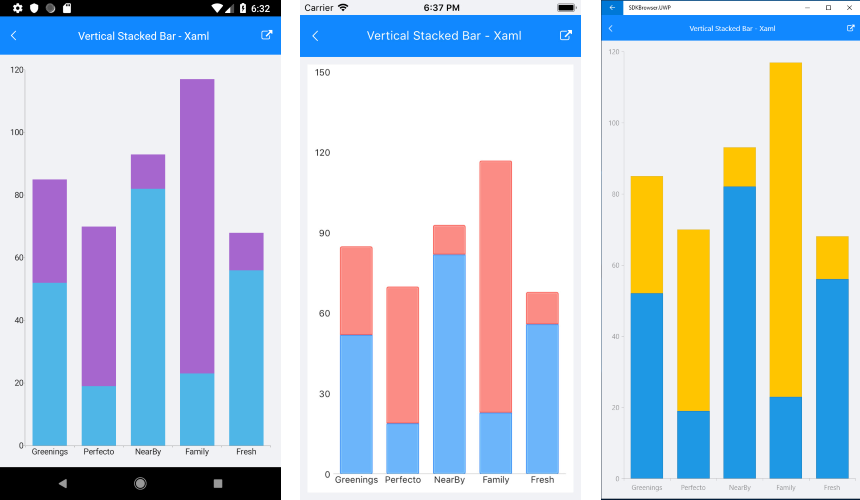
A sample StackBarSeries example can be found in the Chart/Series folder of the SDK Samples Browser application.
Stack Area Series Example
Here is how Stack Area Series looks:
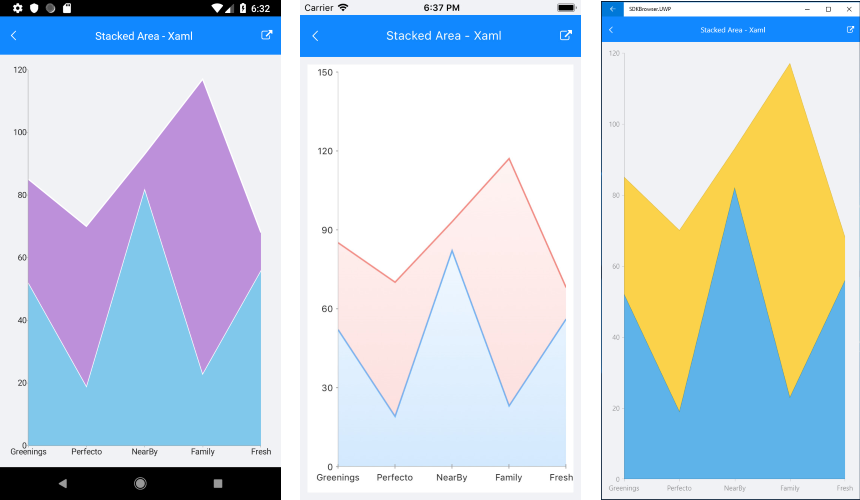
A sample StackAreaSeries example can be found in the Chart/Series folder of the SDK Samples Browser application.
Stack Spline Area Series Example
Here is how Stack Spline Area Series looks:
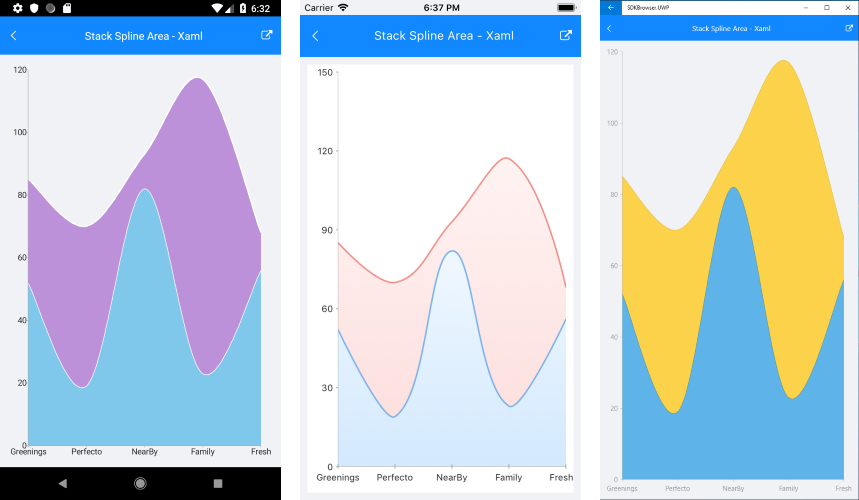
A sample StackSplineSeries example can be found in the Chart/Series folder of the SDK Samples Browser application.