ChartTrackBallBehavior
Overview
ChartTrackBallBehavior is responsible for rendering concise information about several data points in a small popup which displays over its relevant data points. A vertical line is also drawn through the data points for maximum clarity.
With R2 2018 SP release Behaviors property of RadChart was replaced with ChartBehaviors. Behaviors property is marked as obsolete, so please use ChartBehaviors instead.
Features
- ShowTrackInfo(bool): Determines whether the visual information for all the closest data points will be displayed.
- ShowIntersectionPoints(bool): Defines a value indicating whether a visual information for all the closest data points will be displayed.
Example
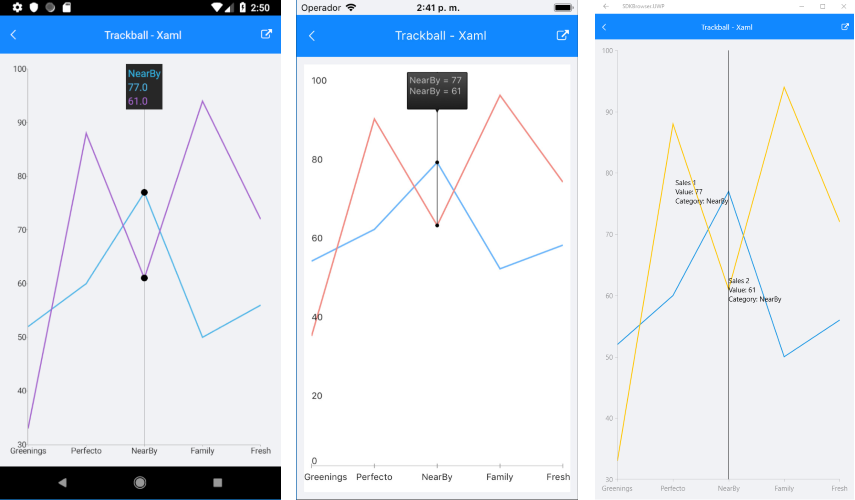
Here is an example of how the Chart TrackBall Behavior works:
First, create the needed business objects, for example:
public class CategoricalData
{
    public object Category { get; set; }

    public double Value { get; set; }
}
Then create a ViewModel:
public class ViewModel
{
    public ObservableCollection<CategoricalData> Data1 { get; set; }
    public ObservableCollection<CategoricalData> Data2 { get; set; }

    public ViewModel()
    {
        this.Data1 = GetCategoricalData1();
        this.Data2 = GetCategoricalData2();
    }

    private static ObservableCollection<CategoricalData> GetCategoricalData1()
    {
        var data = new ObservableCollection<CategoricalData>  {
        new CategoricalData { Category = "Greenings", Value = 52 },
        new CategoricalData { Category = "Perfecto", Value = 60 },
        new CategoricalData { Category = "NearBy", Value = 77 },
        new CategoricalData { Category = "Family", Value = 50 },
        new CategoricalData { Category = "Fresh", Value = 56 },
    };
        return data;
    }

    private static ObservableCollection<CategoricalData> GetCategoricalData2()
    {
        var data = new ObservableCollection<CategoricalData>  {
        new CategoricalData { Category = "Greenings", Value = 33 },
        new CategoricalData { Category = "Perfecto", Value = 88 },
        new CategoricalData { Category = "NearBy", Value = 61 },
        new CategoricalData { Category = "Family", Value = 94 },
        new CategoricalData { Category = "Fresh", Value = 72 },
    };
        return data;
    }
}
Finally, use the following snippet to declare a RadCartesianChart in XAML and in C#:
<telerikChart:RadCartesianChart>
    <telerikChart:RadCartesianChart.BindingContext>
        <local:ViewModel />
    </telerikChart:RadCartesianChart.BindingContext>
    <telerikChart:RadCartesianChart.HorizontalAxis>
        <telerikChart:CategoricalAxis LabelFitMode="MultiLine"
                                      PlotMode="OnTicks" />
    </telerikChart:RadCartesianChart.HorizontalAxis>
    <telerikChart:RadCartesianChart.VerticalAxis>
        <telerikChart:NumericalAxis />
    </telerikChart:RadCartesianChart.VerticalAxis>
    <telerikChart:RadCartesianChart.Series>
        <telerikChart:LineSeries ValueBinding="Value"
                                 CategoryBinding="Category"
                                 DisplayName="Sales 1"
                                 ItemsSource="{Binding Data1}" />
        <telerikChart:LineSeries ValueBinding="Value"
                                 CategoryBinding="Category"
                                 DisplayName="Sales 2"
                                 ItemsSource="{Binding Data2}" />
    </telerikChart:RadCartesianChart.Series>
    <telerikChart:RadCartesianChart.ChartBehaviors>
        <telerikChart:ChartTrackBallBehavior ShowIntersectionPoints="True"
                                             ShowTrackInfo="True" />
    </telerikChart:RadCartesianChart.ChartBehaviors>
</telerikChart:RadCartesianChart>
var chart = new RadCartesianChart
{
    BindingContext = new ViewModel(),
    HorizontalAxis = new CategoricalAxis()
    {
        LabelFitMode = AxisLabelFitMode.MultiLine,
        PlotMode = AxisPlotMode.OnTicks
    },
    VerticalAxis = new NumericalAxis(),
    Series =
    {
        new LineSeries
        {
            ValueBinding = new PropertyNameDataPointBinding("Value"),
            CategoryBinding = new PropertyNameDataPointBinding("Category"),
            DisplayName = "Sales 1"
        },
        new LineSeries
        {
            ValueBinding = new PropertyNameDataPointBinding("Value"),
            CategoryBinding = new PropertyNameDataPointBinding("Category"),
            DisplayName = "Sales 2"
        }
    },
    ChartBehaviors =
    {
        new ChartTrackBallBehavior
        {
            ShowIntersectionPoints = true,
            ShowTrackInfo = true
        }
    }
};

chart.Series[0].SetBinding(ChartSeries.ItemsSourceProperty, "Data1");
chart.Series[1].SetBinding(ChartSeries.ItemsSourceProperty, "Data2");
Where the telerikChart namespace is the following:
xmlns:telerikChart="clr-namespace:Telerik.XamarinForms.Chart;assembly=Telerik.XamarinForms.Chart"
using Telerik.XamarinForms.Chart;
Here is how the trackball looks:
A sample TrackBall example can be found in the Chart/Interactivity folder of the SDK Samples Browser application.