Custom Annotations
You can place arbitary visual elements on the chart plot area by using the CartesianCustomAnnotation and PolarCustomAnnotation.
Cartesian Custom Annotation
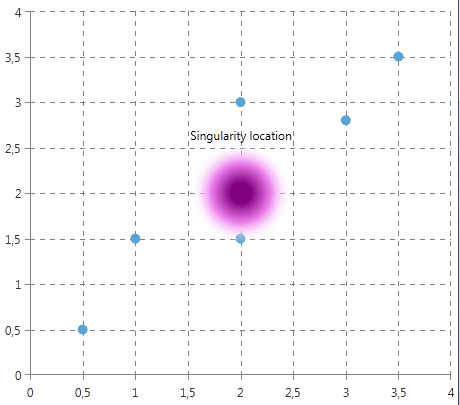
The Cartesian Custom Annotation renders its Content starting at the specified (HorizontalValue, VerticalValue) position. You can change the visualization by using the ContentTemplate property.
Here is what CartesianCustomAnnotation looks like:
<telerik:CartesianCustomAnnotation HorizontalValue="2" VerticalValue="2"
                                   HorizontalAlignment="Center" VerticalAlignment="Center"
                                   VerticalOffset="-8">
    <telerik:CartesianCustomAnnotation.Content>
        <StackPanel Orientation="Vertical">
            <TextBlock Text="Singularity location"/>
            <Rectangle Width="100" Height="100">
                <Rectangle.Fill>
                    <RadialGradientBrush Center="0.5,0.5" RadiusX="0.5" RadiusY="0.5" GradientOrigin="0.5,0.5">
                        <GradientStop Color="Purple" Offset="0.2"></GradientStop>
                        <GradientStop Color="Violet" Offset="0.6"></GradientStop>
                        <GradientStop Color="Transparent" Offset="1"></GradientStop>
                    </RadialGradientBrush>
                </Rectangle.Fill>
            </Rectangle>
        </StackPanel>
    </telerik:CartesianCustomAnnotation.Content>
</telerik:CartesianCustomAnnotation>
Polar Custom Annotation
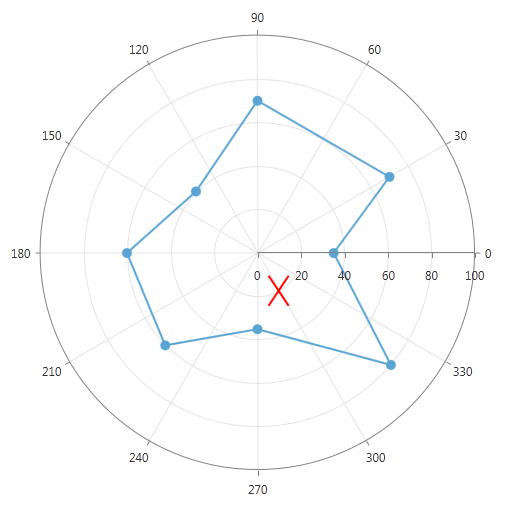
The content of the PolarCustomAnnotation is rendered at the (RadialValue, PolarValue) position.
<telerik:PolarCustomAnnotation PolarValue="20" RadialValue="300"
                               HorizontalAlignment="Center" VerticalAlignment="Center">
    <telerik:PolarCustomAnnotation.Content>
            <Path Stroke="Red" StrokeThickness="2">
                <Path.Data>
                    <PathGeometry>
                        <PathGeometry.Figures>
                            <PathFigure StartPoint="0,0">
                                <LineSegment Point="20,30"/>
                            </PathFigure>
                            <PathFigure StartPoint="0,30">
                                <LineSegment Point="20,0"/>
                            </PathFigure>
                        </PathGeometry.Figures>
                    </PathGeometry>
                </Path.Data>
            </Path>
    </telerik:PolarCustomAnnotation.Content>
</telerik:PolarCustomAnnotation>
Properties
Common:
Content This property sets the content of the annotation.
ContentTemplate This property defines the DataTemplate used to display the content of the annotation.
HorizontalOffset This property specifies an offset in pixels, applied after the annotation is positioned on the axis depending on its Horizontal/Vertical or Polar/Radial values.
VerticalOffset This property specifies an offset in pixels, applied after the annotation is positioned on the axis depending on its Horizontal/Vertical or Polar/Radial values.
Cartesian:
-
HorizontalValue The place on the Horizontal Axis, where the annotation is positioned.
When the axis is numerical (Linear or Logarithmic) a numeric value is expected, and when it is a CategoricalAxis - a category.
-
VerticalValue The place on the Horizontal Axis, where the annotation is positioned.
When the axis is numerical (Linear or Logarithmic) a numeric value is expected, and when it is a CategoricalAxis - a category.
Polar:
PolarValue The place on the Polar Axis, where the annotation is positioned.
-
RadialValue The place on the Radial Axis, where the annotation is positioned.
When the radial axis is NumericRadialAxis a numeric value is expected and when it is a CategoricalRadialAxis - a category.