Stepline
SteplineSeries plot their Categorical data points on Cartesian Area using one categorical and one numerical axis. Points are connected with two straight lines one horizontal and one vertical with an 90° angle between them. Here is how to set up two stepline series:
Initial Setup
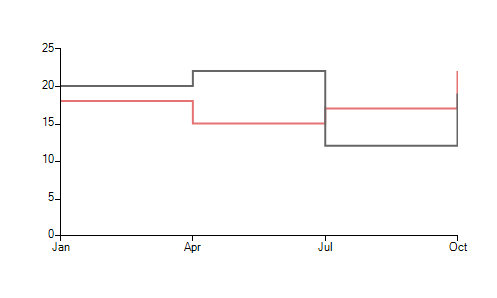
SteplineSeries lineSeries = new SteplineSeries();
lineSeries.DataPoints.Add(new CategoricalDataPoint(20, "Jan"));
lineSeries.DataPoints.Add(new CategoricalDataPoint(22, "Apr"));
lineSeries.DataPoints.Add(new CategoricalDataPoint(12, "Jul"));
lineSeries.DataPoints.Add(new CategoricalDataPoint(19, "Oct"));
this.radChartView1.Series.Add(lineSeries);
SteplineSeries lineSeries2 = new SteplineSeries();
lineSeries2.DataPoints.Add(new CategoricalDataPoint(18, "Jan"));
lineSeries2.DataPoints.Add(new CategoricalDataPoint(15, "Apr"));
lineSeries2.DataPoints.Add(new CategoricalDataPoint(17, "Jul"));
lineSeries2.DataPoints.Add(new CategoricalDataPoint(22, "Oct"));
this.radChartView1.Series.Add(lineSeries2);
Dim lineSeries As New SteplineSeries()
lineSeries.DataPoints.Add(New CategoricalDataPoint(20, "Jan"))
lineSeries.DataPoints.Add(New CategoricalDataPoint(22, "Apr"))
lineSeries.DataPoints.Add(New CategoricalDataPoint(12, "Jul"))
lineSeries.DataPoints.Add(New CategoricalDataPoint(19, "Oct"))
Me.RadChartView1.Series.Add(lineSeries)
Dim lineSeries2 As New SteplineSeries()
lineSeries2.DataPoints.Add(New CategoricalDataPoint(18, "Jan"))
lineSeries2.DataPoints.Add(New CategoricalDataPoint(15, "Apr"))
lineSeries2.DataPoints.Add(New CategoricalDataPoint(17, "Jul"))
lineSeries2.DataPoints.Add(New CategoricalDataPoint(22, "Oct"))
Me.RadChartView1.Series.Add(lineSeries2)
Figure 1: Initial Setup
The essential properties of SteplineSeries are:
BorderWidth: Тhe property determines the thickness of the lines
PointSize: Тhe property denotes the size of the points
ShowLabels: Тhe property determines whether the labels above each point will be visible
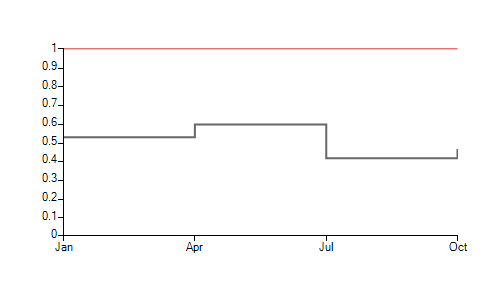
CombineMode: А common property for all categorical series, which introduces a mechanism for combining data points that reside in different series but have the same category. The combine mode can be None, Cluster, Stack and Stack100. In the case of stepline series, None and Cluster mean that the series will be plotted independently of each other, so that they are overlapping. Stack plots the points on top of each other and Stack100 presents the values of one series as a percentage of the other series. The combine mode is best described by a picture:
Figure 2: None/Cluster
Figure 3: Stack
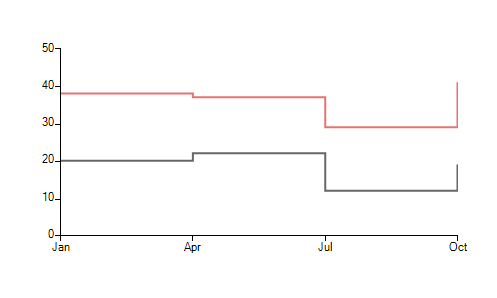
Figure 4: Stack100