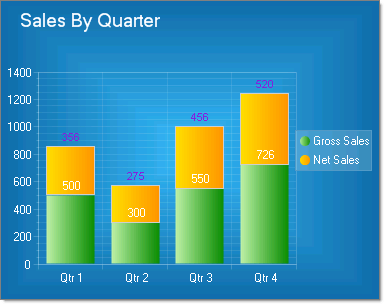
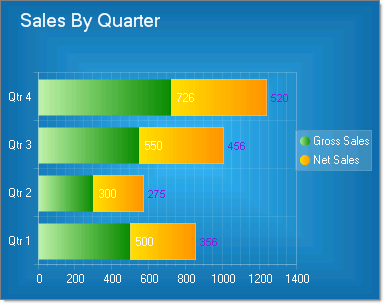
Stacked Bar Charts
Stacked bar charts are used to compare contributions of values to a total across categories. In the examples below the categories are various sources for sales (Internet, Wholesale, Retail) that combine to make the total sales for each quarter. Use the Stacked Bar chart when you need visibility to the combined values for each category.
To create a Vertical Stacked Bar Chart set the SeriesOrientation property to Vertical. Set the RadChart DefaultType property or ChartSeries.Type to StackedBar.
To create a Horizontal Stacked Bar Chart set the SeriesOrientation property to Horizontal. Set the RadChart DefaultType property or ChartSeries.Type to StackedBar.
To display custom labeling on the X-Axis "Qtr 1", "Qtr 2", etc., set the RadChart PlotArea.XAxis Autoscale property to False. Use the PlotArea.XAxis.Items property and for each item set the TextBlock Text property to the desired label.