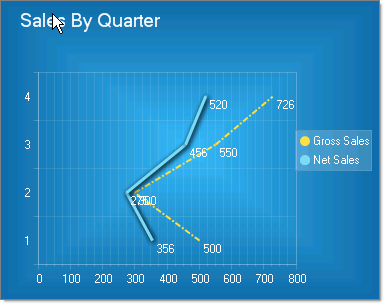
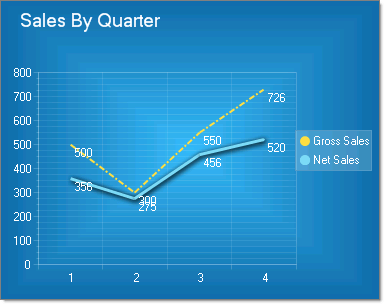
Line Charts
Line charts are used to display a series of data points, typically to show trends over a period of time. One or more series of data can be used and the appearance for each series can be tailored to emphasize the data using unique colors, line thicknesses, shadow, pen style, and point marks.
To create a Vertical Line Chart set the SeriesOrientation property to Vertical. Set the RadChart DefaultType property or ChartSeries.Type to Line.
To create a Vertical Line Chart set the SeriesOrientation property to Horizontal. Set the RadChart DefaultType property or ChartSeries.Type to Line.