Scatter Line Series
Overview
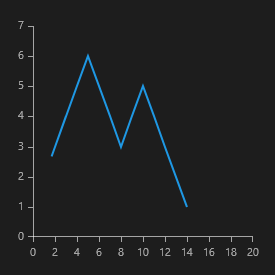
The ScatterLineSeries are represented on the chart as data points connected with straight line segments as shown on the image below.
Properties
ScatterLineSeries class inherits from the ScatterPointSeries class - See the inherited properties.
- Stroke (Brush): Gets or setst the Brush instance that defines the stroke of the line used to present the series.
- StrokeThickness (double): Gets or sets the thickness of the line used to present the series.
Example
Here's an example of how to implement a RadCartesianChart with ScatterLineSeries.
-
First, create a class for the sample data.
public class Data { public double XValue { get; set; } public double YValue { get; set; } } -
Then, create the sample data.
List<Data> sampleData = new List<Data>(); sampleData.Add(new Data() { XValue = 2, YValue = 3 }); sampleData.Add(new Data() { XValue = 3, YValue = 4 }); sampleData.Add(new Data() { XValue = 4, YValue = 5 }); sampleData.Add(new Data() { XValue = 5, YValue = 6 }); sampleData.Add(new Data() { XValue = 6, YValue = 5 }); sampleData.Add(new Data() { XValue = 7, YValue = 4 }); sampleData.Add(new Data() { XValue = 8, YValue = 3 }); sampleData.Add(new Data() { XValue = 9, YValue = 4 }); sampleData.Add(new Data() { XValue = 10, YValue = 5 }); sampleData.Add(new Data() { XValue = 11, YValue = 4 }); sampleData.Add(new Data() { XValue = 12, YValue = 3 }); sampleData.Add(new Data() { XValue = 13, YValue = 2 }); sampleData.Add(new Data() { XValue = 14, YValue = 1 }); this.scatterLineSeries.DataContext = sampleData; -
Finally, create a chart using XAML.
<telerikChart:RadCartesianChart x:Name="scatterLineSeries">
    <telerikChart:RadCartesianChart.VerticalAxis>
        <telerikChart:LinearAxis/>
    </telerikChart:RadCartesianChart.VerticalAxis>
    <telerikChart:RadCartesianChart.HorizontalAxis>
        <telerikChart:LinearAxis/>
    </telerikChart:RadCartesianChart.HorizontalAxis>

    <telerikChart:ScatterLineSeries ItemsSource="{Binding}">
        <telerikChart:ScatterLineSeries.XValueBinding>
            <telerikChart:PropertyNameDataPointBinding PropertyName="XValue"/>
        </telerikChart:ScatterLineSeries.XValueBinding>
        <telerikChart:ScatterLineSeries.YValueBinding>
            <telerikChart:PropertyNameDataPointBinding PropertyName="YValue"/>
        </telerikChart:ScatterLineSeries.YValueBinding>
    </telerikChart:ScatterLineSeries>
</telerikChart:RadCartesianChart>