Point Series
Overview
PointSeries represents its DataPoints as Ellipses.
Properties
PointSeries class inherits from the CategoricalSeriesBase class - See the inherited properties.
- PointSize: Gets or sets the Size of the points. This property will be ignored if PointTemplate property is set.
- LegendTitleBinding: Gets or sets the binding that will be used by any attached legend to display legend item title.
-
PaletteMode: Gets or sets the target type to that chart palette will be applied to. The available types are:
- Series: Applies the palette per series.
- DataPoint: Applies the palette per points.
Example
Here's an example of how to create a RadCartesianChart withPointSeries.
<telerikChart:RadCartesianChart>
<telerikChart:RadCartesianChart.HorizontalAxis>
<telerikChart:CategoricalAxis/>
</telerikChart:RadCartesianChart.HorizontalAxis>
<telerikChart:RadCartesianChart.VerticalAxis>
<telerikChart:LinearAxis/>
</telerikChart:RadCartesianChart.VerticalAxis>
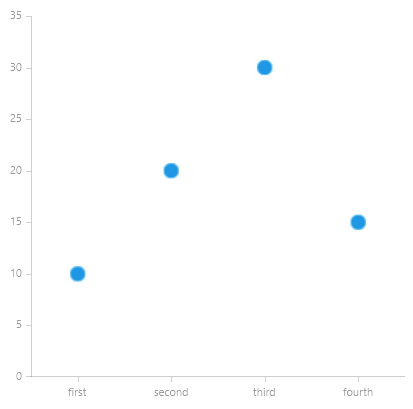
<telerikChart:PointSeries PointSize="15,15">
<telerikCharting:CategoricalDataPoint Category="first" Value="10"/>
<telerikCharting:CategoricalDataPoint Category="second" Value="20"/>
<telerikCharting:CategoricalDataPoint Category="third" Value="30"/>
<telerikCharting:CategoricalDataPoint Category="fourth" Value="15"/>
</telerikChart:PointSeries>
</telerikChart:RadCartesianChart>