Line Series
Overview
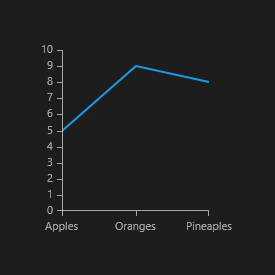
The LineSeries are represented on the chart as data points connected with straight line segments as shown on the image below.
LineSeries class inherits from the CategoricalStrokedSeries class - See the inherited properties.
Example
Here's an example of how to create a RadCartesianChart with LineSeries.
-
First, create a class for the sample data.
public class Data { public string Category { get; set; } public double Value { get; set; } } -
Then create the sample data.
List<Data> data = new List<Data>(); data.Add(new Data() { Category = "Apples", Value = 5 }); data.Add(new Data() { Category = "Oranges", Value = 9 }); data.Add(new Data() { Category = "Pineaples", Value = 8 }); this.lineSeries.DataContext = data; -
Finally, create the chart using XAML.
<telerikChart:RadCartesianChart x:Name="lineSeries" PaletteName="DefaultLight">
    <telerikChart:RadCartesianChart.VerticalAxis>
        <telerikChart:LinearAxis/>
    </telerikChart:RadCartesianChart.VerticalAxis>
    <telerikChart:RadCartesianChart.HorizontalAxis>
        <telerikChart:CategoricalAxis/>
    </telerikChart:RadCartesianChart.HorizontalAxis>

    <telerikChart:LineSeries ItemsSource="{Binding}">
        <telerikChart:LineSeries.CategoryBinding>
            <telerikChart:PropertyNameDataPointBinding PropertyName="Category"/>
        </telerikChart:LineSeries.CategoryBinding>
        <telerikChart:LineSeries.ValueBinding>
            <telerikChart:PropertyNameDataPointBinding PropertyName="Value"/>
        </telerikChart:LineSeries.ValueBinding>
    </telerikChart:LineSeries>
</telerikChart:RadCartesianChart>