Combine Mode
Categorical series in RadChartView have a mechanism which can be used for combining data points that reside in different series but have the same category. This mechanism can be triggered by setting the CombineMode property of the series. It is an enumeration and it allows the following values: None, Cluster, Stack, Stack100.
Categorical series which supports this mechanism are: AreaSeries, BarSeries, LineSeries, PointSeries, RangeBarSeries, BoxPlotSeries. RangeBarSeries and BoxPlotSeries support only None and Cluster modes.
Example 1: Setting the CombineMode property
<telerik:RadCartesianChart Palette="Windows8">
    <telerik:RadCartesianChart.HorizontalAxis>
        <telerik:CategoricalAxis />
    </telerik:RadCartesianChart.HorizontalAxis>
    <telerik:RadCartesianChart.VerticalAxis>
        <telerik:LinearAxis />
    </telerik:RadCartesianChart.VerticalAxis>
    <telerik:RadCartesianChart.Series>
        <telerik:BarSeries CombineMode="None">
            <telerik:BarSeries.DataPoints>
                <telerik:CategoricalDataPoint Category="January" Value="14" />
                <telerik:CategoricalDataPoint Category="February" Value="10" />
                <telerik:CategoricalDataPoint Category="March" Value="7" />
                <telerik:CategoricalDataPoint Category="April" Value="15" />
            </telerik:BarSeries.DataPoints>
        </telerik:BarSeries>
        <telerik:BarSeries CombineMode="None">
            <telerik:BarSeries.DataPoints>
                <telerik:CategoricalDataPoint Category="January" Value="11" />
                <telerik:CategoricalDataPoint Category="February" Value="15" />
                <telerik:CategoricalDataPoint Category="March" Value="3" />
                <telerik:CategoricalDataPoint Category="April" Value="10" />
            </telerik:BarSeries.DataPoints>
        </telerik:BarSeries>
        <telerik:BarSeries CombineMode="None">
            <telerik:BarSeries.DataPoints>
                <telerik:CategoricalDataPoint Category="January" Value="8" />
                <telerik:CategoricalDataPoint Category="February" Value="12" />
                <telerik:CategoricalDataPoint Category="March" Value="19" />
                <telerik:CategoricalDataPoint Category="April" Value="11" />
            </telerik:BarSeries.DataPoints>
        </telerik:BarSeries>
    </telerik:RadCartesianChart.Series>
</telerik:RadCartesianChart>
-
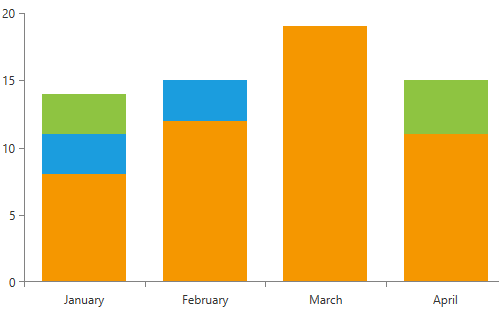
None: In this mode each series will be plotted on top of each other. The series that is defined last will be rendered on top. You can change that by setting the ZIndex property of the series.
Figure 1: CombineMode None
-
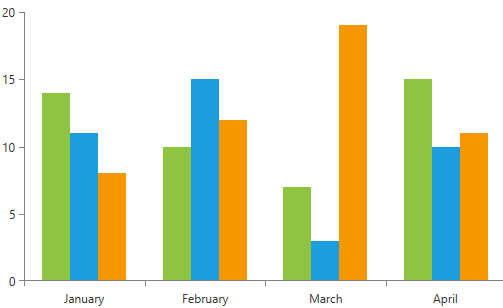
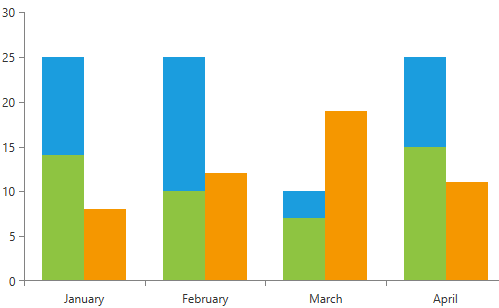
Cluster: In this mode each series will be plotted independently of each other, so that they are not overlapping.
Figure 2: CombineMode Cluster
-
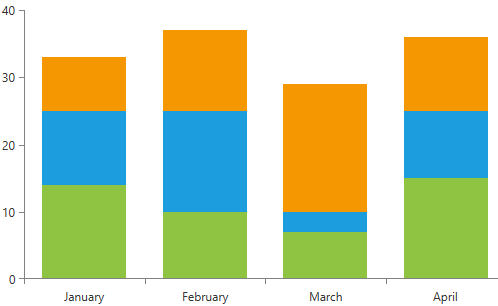
Stack: In this mode all series form stacks. The points of all series are placed on top of each other. The drawing of the next point will start from the value of the previous one.
Figure 3: CombineMode Stack
-
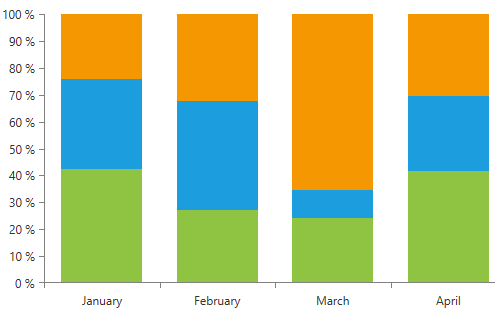
Stack100: When this mode is set all series form stacks that occupy 100% of the plot area. It shows the combined contribution of values as percentages where the combined total for each category is 100 percent. It's good to use it when the relationship between values in a category is more significant than the amounts.
Figure 4: CombineMode Stack100
Utilizing the StackGroupKey Property
If the CombineMode property of the series is either Stack or Stack100, the StackGroupKey property of the series can be set in order to define in which stack group it will be included. Example 2 demonstrates this property.
Example 2: Setting the StackGroupKey property
 <telerik:RadCartesianChart Palette="Windows8">
    <telerik:RadCartesianChart.HorizontalAxis>
        <telerik:CategoricalAxis />
    </telerik:RadCartesianChart.HorizontalAxis>
    <telerik:RadCartesianChart.VerticalAxis>
        <telerik:LinearAxis />
    </telerik:RadCartesianChart.VerticalAxis>
    <telerik:RadCartesianChart.Series>
        <telerik:BarSeries CombineMode="Stack"  StackGroupKey="FirstStackGroup">
            <telerik:BarSeries.DataPoints>
                <telerik:CategoricalDataPoint Category="January" Value="14" />
                <telerik:CategoricalDataPoint Category="February" Value="10" />
                <telerik:CategoricalDataPoint Category="March" Value="7" />
                <telerik:CategoricalDataPoint Category="April" Value="15" />
            </telerik:BarSeries.DataPoints>
        </telerik:BarSeries>
        <telerik:BarSeries CombineMode="Stack" StackGroupKey="FirstStackGroup">
            <telerik:BarSeries.DataPoints>
                <telerik:CategoricalDataPoint Category="January" Value="11" />
                <telerik:CategoricalDataPoint Category="February" Value="15" />
                <telerik:CategoricalDataPoint Category="March" Value="3" />
                <telerik:CategoricalDataPoint Category="April" Value="10" />
            </telerik:BarSeries.DataPoints>
        </telerik:BarSeries>
        <telerik:BarSeries CombineMode="Stack" StackGroupKey="SecondStackGroup" >
            <telerik:BarSeries.DataPoints>
                <telerik:CategoricalDataPoint Category="January" Value="8" />
                <telerik:CategoricalDataPoint Category="February" Value="12" />
                <telerik:CategoricalDataPoint Category="March" Value="19" />
                <telerik:CategoricalDataPoint Category="April" Value="11" />
            </telerik:BarSeries.DataPoints>
        </telerik:BarSeries>
    </telerik:RadCartesianChart.Series>
</telerik:RadCartesianChart>
Figure 5: Result from Example 2
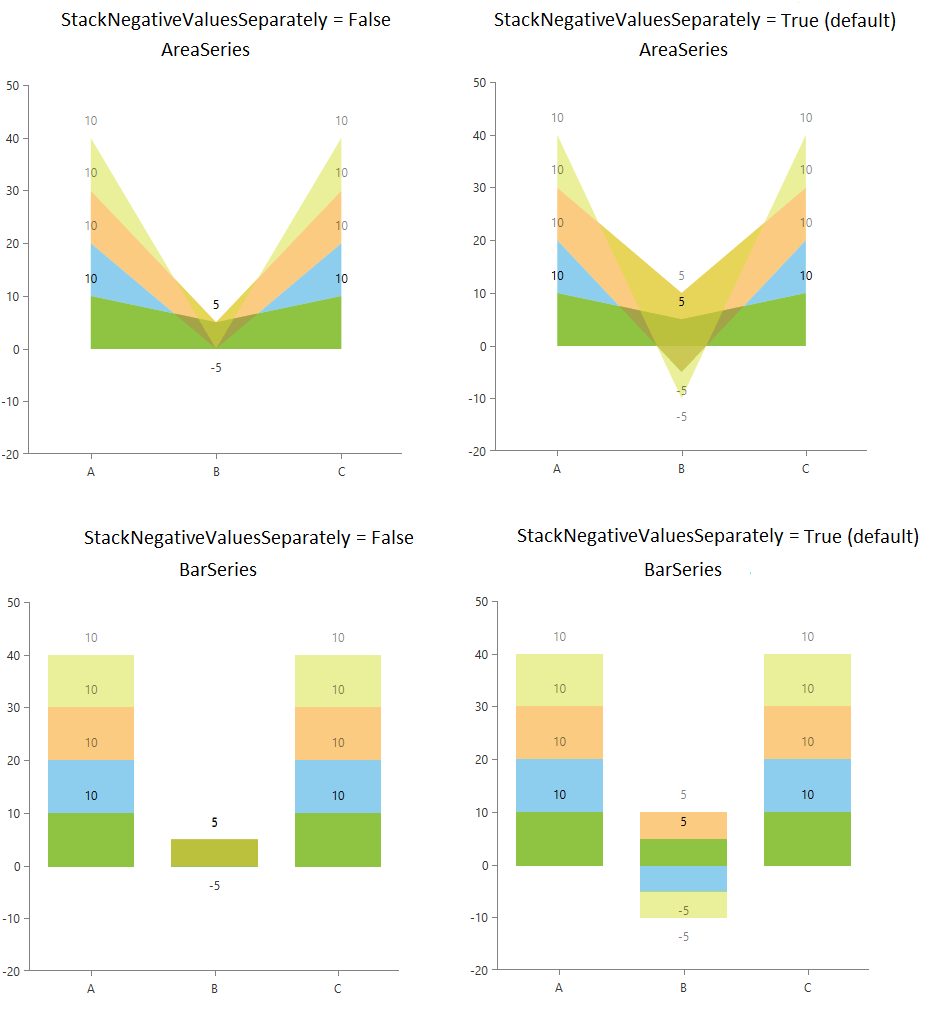
Stacking Mixed Values in the Same Stack
By default when you have mixed values (negative and positive) in the same category, those will be added in separate value stacks. This means that all positive values will be combined into one stack and all negative values into another stack.
To change this behavior and use a single stack for all values, set the ChartViewExtensions.StackNegativeValuesSeparately attached property to False. The property is applied to the RadCartesianChart control.
Example 3: Setting the ChartViewExtensions.StackNegativeValuesSeparately property
<telerik:RadCartesianChart Palette="Windows8" chartView:ChartViewExtensions.StackNegativeValuesSeparately="False">
    <telerik:RadCartesianChart.VerticalAxis>
        <telerik:LinearAxis />
    </telerik:RadCartesianChart.VerticalAxis>
    <telerik:RadCartesianChart.HorizontalAxis>
        <telerik:CategoricalAxis PlotMode="OnTicksPadded" />
    </telerik:RadCartesianChart.HorizontalAxis>
    <telerik:RadCartesianChart.Series>
        <telerik:AreaSeries CombineMode="Stack" ShowLabels="True">
            <telerik:AreaSeries.DataPoints>
                <telerik:CategoricalDataPoint Category="A" Value="10" />
                <telerik:CategoricalDataPoint Category="B" Value="5" />
                <telerik:CategoricalDataPoint Category="C" Value="10" />
            </telerik:AreaSeries.DataPoints>
        </telerik:AreaSeries>
        <telerik:AreaSeries CombineMode="Stack" Opacity="0.5" ShowLabels="True">
            <telerik:AreaSeries.DataPoints>
                <telerik:CategoricalDataPoint Category="A" Value="10" />
                <telerik:CategoricalDataPoint Category="B" Value="-5" />
                <telerik:CategoricalDataPoint Category="C" Value="10" />
            </telerik:AreaSeries.DataPoints>
        </telerik:AreaSeries>
        <telerik:AreaSeries CombineMode="Stack" Opacity="0.5" ShowLabels="True">
            <telerik:AreaSeries.DataPoints>
                <telerik:CategoricalDataPoint Category="A" Value="10" />
                <telerik:CategoricalDataPoint Category="B" Value="5" />
                <telerik:CategoricalDataPoint Category="C" Value="10" />
            </telerik:AreaSeries.DataPoints>
        </telerik:AreaSeries>
        <telerik:AreaSeries CombineMode="Stack" Opacity="0.5" ShowLabels="True">
            <telerik:AreaSeries.DataPoints>
                <telerik:CategoricalDataPoint Category="A" Value="10" />
                <telerik:CategoricalDataPoint Category="B" Value="-5" />
                <telerik:CategoricalDataPoint Category="C" Value="10" />
            </telerik:AreaSeries.DataPoints>
        </telerik:AreaSeries>
    </telerik:RadCartesianChart.Series>
</telerik:RadCartesianChart>
The "chartView" namespace refers to the following -
xmlns:chartView="clr-namespace:Telerik.Windows.Controls.ChartView;assembly=Telerik.Windows.Controls.Chart"
Figure 5: Comparison between the stack modes