Creating a Chart Declaratively
In some situations you might want to create a chart declaratively - in XAML. This is useful when you have static data that will not change in time.
This tutorial will walk you through the common tasks of:
In order to use RadChart control in your projects you have to add references to Telerik.Windows.Controls.Charting.dll.
Adding RadChart and Setting the DefaultView Property
For most of the cases, where a chart has a title, a legend and a chart area, RadChart control provides you with a DefaultView that contains these three elements.
In your XAML file, add a new RadChart declaration and make a new instance of ChartDefaultView which has to be set to the RadChart.DefaultView property.
<telerik:RadChart>
    <telerik:RadChart.DefaultView>
        <telerik:ChartDefaultView />
    </telerik:RadChart.DefaultView>
</telerik:RadChart>
To use RadChart in your XAML file, add a reference to the following namespaces: xmlns:telerikChart="clr-namespace:Telerik.Windows.Controls;assembly=Telerik.Windows.Controls.Charting" and xmlns:telerikCharting="clr-namespace:Telerik.Windows.Controls.Charting;assembly=Telerik.Windows.Controls.Charting"
The ChartDefaultView contains ChartTitle, ChartLegend and ChartArea and you have to use them to build the chart in the way you need. The next several sections will show you how to set these properties.
Adding ChartTitle
After declaring the default view, the next step is to add a chart title. Find your RadChart declaration and add chart title "Year 2009" which is positioned in the center:
<telerik:RadChart VerticalAlignment="Top">
    <telerik:RadChart.DefaultView>
        <telerik:ChartDefaultView>
            <telerik:ChartDefaultView.ChartTitle>
                <telerik:ChartTitle Content="Year 2009" HorizontalAlignment="Center"/>
            </telerik:ChartDefaultView.ChartTitle>
        </telerik:ChartDefaultView>
    </telerik:RadChart.DefaultView>
</telerik:RadChart>
Adding ChartLegend
Add a ChartLegend declaration to your default view declaration. If you want the data series which is added later in the ChartArea to be automatically added in the legend, set the UseAutoGeneratedItems property to True.
<telerik:RadChart VerticalAlignment="Top">
    <telerik:RadChart.DefaultView>
        <telerik:ChartDefaultView>

            <telerik:ChartDefaultView.ChartTitle>
                <telerik:ChartTitle Content="Year 2009" HorizontalAlignment="Center"/>
            </telerik:ChartDefaultView.ChartTitle>

            <telerik:ChartDefaultView.ChartLegend>
                <telerik:ChartLegend x:Name="chartLegend" UseAutoGeneratedItems="True" />
            </telerik:ChartDefaultView.ChartLegend>

        </telerik:ChartDefaultView>
    </telerik:RadChart.DefaultView>
</telerik:RadChart>
Adding ChartArea
The third step in the populating a RadChart with data is adding a ChartArea.
Note that to show the DataSeries in the legend you have to also set the ChartArea.LegendName property with the name of the ChartLegend you want.
<telerik:RadChart VerticalAlignment="Top">
    <telerik:RadChart.DefaultView>
        <telerik:ChartDefaultView>
            <telerik:ChartDefaultView.ChartTitle>
                <telerik:ChartTitle Content="Year 2009" HorizontalAlignment="Center"/>
            </telerik:ChartDefaultView.ChartTitle>
            <telerik:ChartDefaultView.ChartLegend>
                <telerik:ChartLegend x:Name="chartLegend" UseAutoGeneratedItems="True" />
            </telerik:ChartDefaultView.ChartLegend>
            <telerik:ChartDefaultView.ChartArea>
                <telerik:ChartArea LegendName="chartLegend" />
            </telerik:ChartDefaultView.ChartArea>
        </telerik:ChartDefaultView>
    </telerik:RadChart.DefaultView>
</telerik:RadChart>
Adding DataSeries
The ChartArea has a list of DataSeries, where you have to add one DataSeries per the chart graphic you want to see. The DataSeries has a property Definition of type ISeriesDefinition where the chart type has to be specified - LineSeriesDefinition for line chart, BarSeriesDefinition for bar chart, etc. The last thing you have to define is the data for each DataSeries: simply add as many DataPoints as you need - one for each point of the chart.
The DataPoint class represents a single piece of data that is visualized in a chart series. For each DataPoint, you can define several values depending on the chart type: XValue and YValue, High and Low, Open and Close, etc. These values are used later to visually calculate and draw the chart graphic.
Other properties of DataPoint are the LegendLable and the LegendFormat. The first one specifies the text displayed in the ChartLegend related to that DataSeries, while the second one defines the format of the labels.
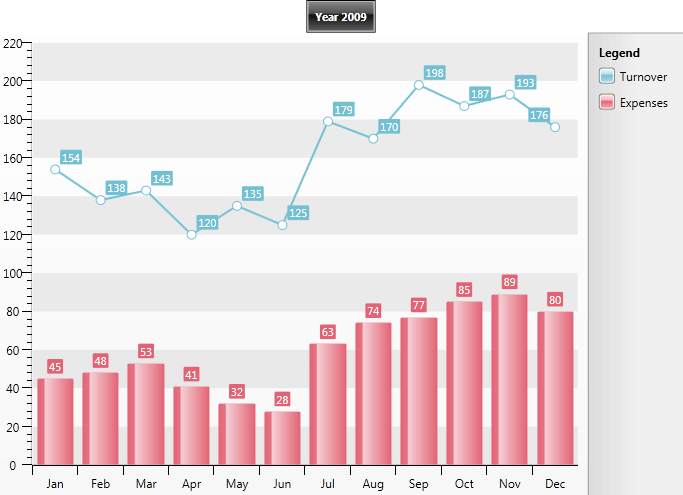
The XAML bellow defines LineSeriesDefinition, that represents the line chart showing the Turnover for year 2009. The data is defined as DataPoints, where Y-Axis (YValue) is set with the desired value. The second data series is BarSeriesDefinition for the Expenses defined in a similar way.
<telerik:RadChart VerticalAlignment="Top">
    <telerik:RadChart.DefaultView>
        <telerik:ChartDefaultView>

            <telerik:ChartDefaultView.ChartTitle>
                <telerik:ChartTitle Content="Year 2009" HorizontalAlignment="Center"/>
            </telerik:ChartDefaultView.ChartTitle>

            <telerik:ChartDefaultView.ChartLegend>
                <telerik:ChartLegend x:Name="chartLegend" UseAutoGeneratedItems="True" />
            </telerik:ChartDefaultView.ChartLegend>

            <telerik:ChartDefaultView.ChartArea>
                <telerik:ChartArea LegendName="chartLegend">
                    <telerik:ChartArea.DataSeries>

                        <!-- Line Chart -->
                        <telerik:DataSeries LegendLabel="Turnover">
                            <telerik:DataSeries.Definition>
                                <telerik:LineSeriesDefinition  />
                            </telerik:DataSeries.Definition>
                            <telerik:DataPoint YValue="154" XCategory="Jan"/>
                            <telerik:DataPoint YValue="138" XCategory="Feb"/>
                            <telerik:DataPoint YValue="143" XCategory="Mar"/>
                            <telerik:DataPoint YValue="120" XCategory="Apr"/>
                            <telerik:DataPoint YValue="135" XCategory="May"/>
                            <telerik:DataPoint YValue="125" XCategory="Jun"/>
                            <telerik:DataPoint YValue="179" XCategory="Jul"/>
                            <telerik:DataPoint YValue="170" XCategory="Aug"/>
                            <telerik:DataPoint YValue="198" XCategory="Sep"/>
                            <telerik:DataPoint YValue="187" XCategory="Oct"/>
                            <telerik:DataPoint YValue="193" XCategory="Nov"/>
                            <telerik:DataPoint YValue="176" XCategory="Dec"/>
                        </telerik:DataSeries>

                        <!-- Bar Chart -->
                        <telerik:DataSeries LegendLabel="Expenses">
                            <telerik:DataSeries.Definition>
                                <telerik:BarSeriesDefinition />
                            </telerik:DataSeries.Definition>
                            <telerik:DataPoint YValue="45" XCategory="Jan"/>
                            <telerik:DataPoint YValue="48" XCategory="Feb"/>
                            <telerik:DataPoint YValue="53" XCategory="Mar"/>
                            <telerik:DataPoint YValue="41" XCategory="Apr"/>
                            <telerik:DataPoint YValue="32" XCategory="May"/>
                            <telerik:DataPoint YValue="28" XCategory="Jun"/>
                            <telerik:DataPoint YValue="63" XCategory="Jul"/>
                            <telerik:DataPoint YValue="74" XCategory="Aug"/>
                            <telerik:DataPoint YValue="77" XCategory="Sep"/>
                            <telerik:DataPoint YValue="85" XCategory="Oct"/>
                            <telerik:DataPoint YValue="89" XCategory="Nov"/>
                            <telerik:DataPoint YValue="80" XCategory="Dec"/>
                        </telerik:DataSeries>
                    </telerik:ChartArea.DataSeries>
                </telerik:ChartArea>
            </telerik:ChartDefaultView.ChartArea>
        </telerik:ChartDefaultView>
    </telerik:RadChart.DefaultView>
</telerik:RadChart>
The result is categorical chart, where on X-Axis you can see the months: