UI for iOS has been discontinued. Please refer to this page for more information.
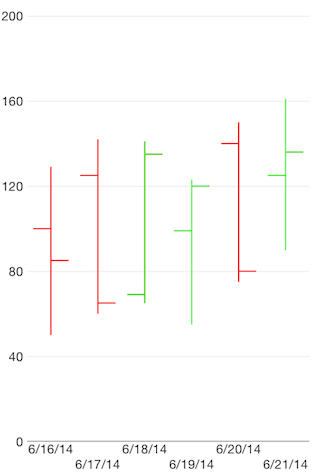
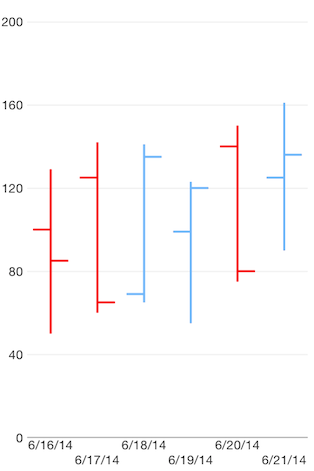
TKChart supports Ohlc stock series. This series operates with a special kind of data in the form of four parameters defining the stock market - open, high, low, and close. The high and low values show the price range (the highest and lowest prices) over one unit of time. The open and close values indicate the opening and closing price of the stock for the corresponding period. The width of the ohlc bar is determined by the period between 2 bars and the range of the axis. You sould use the minorTickIntervalUnit property of TKChartDateTimeAxis to change the period between 2 ohlc bars. Here is how to set up OHLC series:
NSArray *openPrices = @[@100, @125, @69, @99, @140, @125];
NSArray *closePrices = @[@85, @65, @135, @120, @80, @136];
NSArray *lowPrices = @[@50, @60, @65, @55, @75, @90];
NSArray *highPrices = @[@129, @142, @141, @123, @150, @161];
NSDate *dateNow = [NSDate date];
NSMutableArray *financialDataPoints = [[NSMutableArray alloc] init];
for (int i = 0; i < openPrices.count; i++) {
    NSDate *date = [dateNow dateByAddingTimeInterval:60 * 60 * 24 * i];
    TKChartFinancialDataPoint *dataPoint = [TKChartFinancialDataPoint dataPointWithX:date open:openPrices[i] high:highPrices[i] low:lowPrices[i] close:closePrices[i]];
    [financialDataPoints addObject:dataPoint];
}

TKChartOhlcSeries *ohlcSeries = [[TKChartOhlcSeries alloc] initWithItems:financialDataPoints];
[chart addSeries:ohlcSeries];
TKChartDateTimeAxis *xAxis = (TKChartDateTimeAxis *)chart.xAxis;
xAxis.minorTickIntervalUnit = TKChartDateTimeAxisIntervalUnitDays;
xAxis.plotMode = TKChartAxisPlotModeBetweenTicks;
xAxis.majorTickInterval = 1;
let openPrices = [100, 125, 69, 99, 140, 125]
let closePrices = [85, 65, 135, 120, 80, 136]
let lowPrices = [50, 60, 65, 55, 75, 90]
let highPrices = [129, 142, 141, 123, 150, 161]
let dateNow = Date()
var financialDataPoints = [TKChartFinancialDataPoint]()

for i in 0 ..< openPrices.count {
    let date = dateNow.addingTimeInterval(CDouble(60 * 60 * 24 * i))
    financialDataPoints.append(TKChartFinancialDataPoint(x: date, open: openPrices[i] as NSNumber?, high: highPrices[i] as NSNumber?, low: lowPrices[i] as NSNumber?, close: closePrices[i] as NSNumber?))
}

let ohlcSeries = TKChartOhlcSeries(items: financialDataPoints)
chart.addSeries(ohlcSeries)

let xAxis = chart.xAxis as! TKChartDateTimeAxis
xAxis.minorTickIntervalUnit = TKChartDateTimeAxisIntervalUnit.days
xAxis.setPlotMode(TKChartAxisPlotMode.betweenTicks)
xAxis.majorTickInterval = 1
var openPrices = new [] { 100, 125, 69, 99, 140, 125 };
var closePrices = new [] { 85, 65, 135, 120, 80, 136 };
var lowPrices = new [] { 50, 60, 65, 55, 75, 90 };
var highPrices = new [] { 129, 142, 141, 123, 150, 161 };
var dateNow = NSDate.Now;
var financialDataPoints = new List<TKChartFinancialDataPoint> ();

for (int i = 0; i < openPrices.Length; ++i) {
    var date = dateNow.AddSeconds ((double)(60 * 60 * 24 * i));
    financialDataPoints.Add (new TKChartFinancialDataPoint (date, new NSNumber (openPrices [i]), new NSNumber (highPrices [i]),
        new NSNumber (lowPrices [i]), new NSNumber (closePrices [i]), null));
}

var ohlcSeries = new TKChartOhlcSeries (financialDataPoints.ToArray ());
chart.AddSeries (ohlcSeries);

var xAxis = chart.XAxis as TKChartDateTimeAxis;
xAxis.MinorTickIntervalUnit = TKChartDateTimeAxisIntervalUnit.Days;
xAxis.PlotMode = TKChartAxisPlotMode.BetweenTicks;
xAxis.MajorTickInterval = 1;
If you want to customize the appearance of ohlc series, you should implement the TKChartDelegate protocol as shown below::
- (TKChartPaletteItem *)chart:(TKChart *)chart paletteItemForSeries:(TKChartSeries *)series atIndex:(NSInteger)index
{
    id<TKChartData> dataPoint = [series dataPointAtIndex:index];
    TKStroke *stroke;
    if ([dataPoint.close doubleValue] < [dataPoint.open doubleValue]) {
        stroke = [TKStroke strokeWithColor:[UIColor redColor]];
    } else {
        stroke = [TKStroke strokeWithColor:[UIColor greenColor]];
    }

    TKChartPaletteItem *paletteItem = [TKChartPaletteItem paletteItemWithStroke:stroke];
    return paletteItem;
}
func chart(_ chart: TKChart, paletteItemFor series: TKChartSeries, at index: Int) -> TKChartPaletteItem? {
    let dataPoint = series.dataPoint(at: UInt(index))

    var stroke: TKStroke
    if dataPoint!.close!.doubleValue < dataPoint!.open!.doubleValue  {
        stroke = TKStroke(color: UIColor.red)
    } else {
        stroke = TKStroke(color: UIColor.green)
    }

    let paletteItem = TKChartPaletteItem(stroke: stroke)
    return paletteItem
}
public override TKChartPaletteItem PaletteItemForSeries (TKChart chart, TKChartSeries series, nint index)
{
    var dataPoint = series.DataPointAtIndex ((uint)index);
    TKStroke stroke = null;
    if (dataPoint.Close.DoubleValue < dataPoint.Open.DoubleValue) {
        stroke = new TKStroke (UIColor.Red);
    } else {
        stroke = new TKStroke (UIColor.Green);
    }
    var paletteItem = new TKChartPaletteItem (stroke);
    return paletteItem;
}