UI for iOS has been discontinued. Please refer to this page for more information.
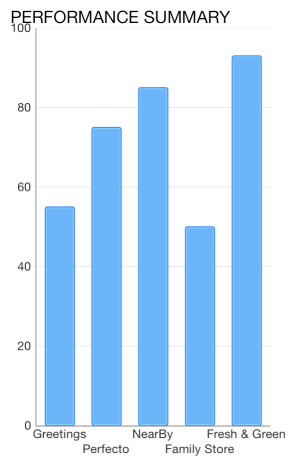
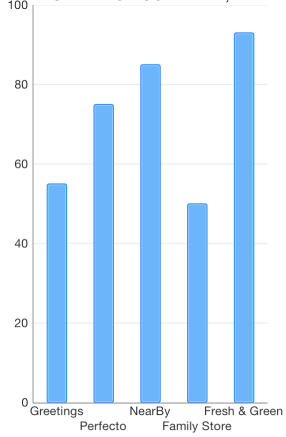
TKChartColumnSeries are used to visualize data points as column blocks where the height of each bar denotes the magnitude of its value. The following snippet demonstrates how to manually populate one Column series:
NSMutableArray *array = [[NSMutableArray alloc] init];
for (int i = 0; i<8; i++) {
    [array addObject:[[TKChartDataPoint alloc] initWithX:@(i+1) Y:@(arc4random() % 100)]];
}

TKChartColumnSeries *series = [[TKChartColumnSeries alloc] initWithItems:array];
series.style.paletteMode = TKChartSeriesStylePaletteModeUseItemIndex;
series.selection = TKChartSeriesSelectionDataPoint;

series.maxColumnWidth = @50;
series.minColumnWidth = @20;

[_chart addSeries:series];
var items = [TKChartDataPoint]()
for i in 0..<8 {
    items.append(TKChartDataPoint(x:(i+1), y:Int(arc4random()%100)))
}

let series = TKChartColumnSeries(items:items)
series.style.paletteMode = TKChartSeriesStylePaletteMode.useItemIndex
series.selection = TKChartSeriesSelection.dataPoint

series.maxColumnWidth = 50
series.minColumnWidth = 20

chart.addSeries(series)
Random r = new Random ();
List<TKChartDataPoint> list = new List<TKChartDataPoint> ();
for (int i = 0; i < 8; i++) {
    list.Add(new TKChartDataPoint (new NSNumber (i+1), new NSNumber (r.Next () % 100)));
}

TKChartColumnSeries series = new TKChartColumnSeries (list.ToArray());
series.Style.PaletteMode = TKChartSeriesStylePaletteMode.UseItemIndex;
series.Selection = TKChartSeriesSelection.DataPoint;

series.MaxColumnWidth = 50;
series.MinColumnWidth = 20;

chart.AddSeries(series);
If you want to cluster multiple column series side by side, they should use a shared x-axis:
for (int i = 0; i < 4; i++) {
    NSMutableArray *points = [[NSMutableArray alloc] init];
    for (int j = 1; j < 8; j++) {
        [points addObject:[[TKChartDataPoint alloc] initWithX:@(j) Y:@(arc4random() % 100)]];
    }

    TKChartSeries *series = [[TKChartColumnSeries alloc] initWithItems:points];

    series.title = [NSString stringWithFormat:@"Series %d", i];
    series.stackInfo = stackInfo;
    [_chart addSeries:series];
}
for i in 0..<4 {
    var points = [TKChartDataPoint]()
    for j in 1..<8 {
        points.append(TKChartDataPoint(x: j, y: Int(arc4random() % (100))))
    }
    let series = TKChartColumnSeries(items: points)
    series.title = "Series \(i)"
    series.stackInfo = stackInfo
    series.selection = TKChartSeriesSelection.series
    chart.addSeries(series)
}
Random r = new Random();
for (int i = 0; i < 4; i++) {
    List<TKChartDataPoint> list = new List<TKChartDataPoint>();
    for (int j = 0; j < 8; j++) {
        list.Add(new TKChartDataPoint(new NSNumber(j), new NSNumber(r.Next() % 100)));
    }

    TKChartColumnSeries series = new TKChartColumnSeries (list.ToArray ());
    series.Title = String.Format ("Series %d", i);
    series.StackInfo = stackInfo;
    series.Selection = TKChartSeriesSelection.Series;
    chart.AddSeries (series);
}

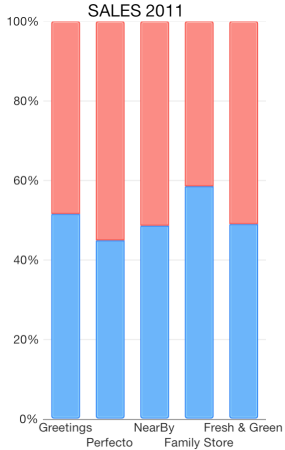
The TKChartColumnSeries can be combined by using different stack modes.
The Stack plots the points on top of each other.
TKChartStackInfo *stackInfo = [[TKChartStackInfo alloc] initWithID:@(1) withStackMode:TKChartStackModeStack];

TKChartAreaSeries *seriesForIncome = [[TKChartAreaSeries alloc] initWithItems:pointsWithCategoriesAndValues];
seriesForIncome.stackInfo = stackInfo;

TKChartAreaSeries *seriesForExpences = [[TKChartAreaSeries alloc] initWithItems:pointsWithCategoriesAndValues2];
seriesForExpences.stackInfo = stackInfo;

[chart beginUpdates];
[chart addSeries:seriesForIncome];
[chart addSeries:seriesForExpences];
[chart endUpdates];
let stackInfo = TKChartStackInfo(id: 1, with: TKChartStackMode.stack)

let seriesForIncome = TKChartAreaSeries(items: pointsWithCategoriesAndValues)
seriesForIncome.stackInfo = stackInfo

let seriesForExpenses = TKChartAreaSeries(items: pointsWithCategoriesAndValues2)
seriesForExpenses.stackInfo = stackInfo

chart.beginUpdates()
chart.addSeries(seriesForIncome)
chart.addSeries(seriesForExpenses)
chart.endUpdates()
var stackInfo = new TKChartStackInfo (new NSNumber (1), TKChartStackMode.Stack);

var seriesForIncome = new TKChartAreaSeries (pointsWithCategoriesAndValues.ToArray ());
seriesForIncome.StackInfo = stackInfo;

var seriesForExpenses = new TKChartAreaSeries (pointsWithCategoriesAndValues2.ToArray ());
seriesForExpenses.StackInfo = stackInfo;

chart.BeginUpdates ();
chart.AddSeries (seriesForIncome);
chart.AddSeries (seriesForExpenses);
chart.EndUpdates ();

The Stack100 displays the value as percent.
If you want to customize the appearance of a column series, you should change its style properties.
You can change the fill and stroke in the following manner:
series.style.palette = [[TKChartPalette alloc] init];

TKChartPaletteItem *palleteItem = [[TKChartPaletteItem alloc] init];
palleteItem.fill = [TKSolidFill solidFillWithColor:[UIColor redColor]];
palleteItem.stroke = [TKStroke strokeWithColor:[UIColor blackColor]];

[series.style.palette addPaletteItem:palleteItem];
[chart addSeries:series];
series.style.palette = TKChartPalette()

let paletteItem = TKChartPaletteItem()
paletteItem.fill = TKSolidFill(color: UIColor.red)
paletteItem.stroke = TKStroke(color: UIColor.black)
series.style.palette!.addItem(paletteItem)
chart.addSeries(series)
series.Style.Palette = new TKChartPalette ();

var paletteItem = new TKChartPaletteItem ();
paletteItem.Fill = new TKSolidFill (UIColor.Red);
paletteItem.Stroke = new TKStroke (UIColor.Black);
series.Style.Palette.AddPaletteItem (paletteItem);
chart.AddSeries (series);

You can change the gap between columns with the gapLength property/
series.gapLength = 0.6;
series.gapLength = 0.6
series.GapLength = 0.6f;
Note that the value should be between 0 and 1, where a value of 0 means that a bar would take the entire space between two ticks, while a value of 1 means the bar will have zero width as all the space should appear as a gap.
If you need to limit the width of the columns you can set the series maxColumnWidth and minColumnWidth properties. These properties allow you to have required minimum and possible maximum width for your series.
series.maxColumnWidth = @50;
series.minColumnWidth = @20;
series.maxColumnWidth = 50
series.minColumnWidth = 20
series.MaxColumnWidth = 50;
series.MinColumnWidth = 20;