UI for iOS has been discontinued. Please refer to this page for more information.
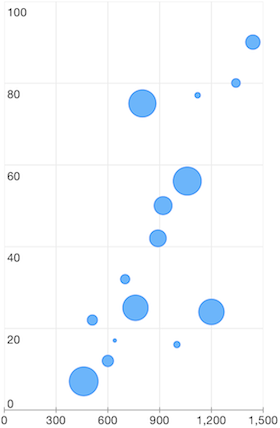
TKChartBubbleSeries derives from TKChartScatterSeries and it represents a bubble chart. Bubble series visualizes TKChartBubbleDataPoint which has three parameters - dataXValue, dataYValue and area. The scale and biggestBubbleDiameterForAutoscale properties determine the diameter of a bubble on the chart.
Here is an example of a bubble chart:
for (int i = 0; i < 2; i++) {
    NSMutableArray *points = [[NSMutableArray alloc] init];
    for (int i = 0; i < 20; i++) {
        [points addObject:[[TKChartBubbleDataPoint alloc] initWithX:@(arc4random() % 1450) Y:@(arc4random() % 150) area:@(arc4random() % 200)]];
    }

    TKChartBubbleSeries *series = [[TKChartBubbleSeries alloc] initWithItems:points];
for i in 0..<2 {
    var points = [TKChartBubbleDataPoint]()
    for _ in 0..<20 {
        let randomX = Int(arc4random()%1450)
        let randomY = Int(arc4random()%150)
        let area = Int(arc4random()%200)
        points.append(TKChartBubbleDataPoint(x:randomX, y:randomY, area:area as NSNumber?))
    }
    let series = TKChartBubbleSeries(items: points)
Random r = new Random ();
for (int i = 0; i < 2; i++) {
    List<TKChartBubbleDataPoint> list = new List<TKChartBubbleDataPoint> ();
    for (int j = 0; j < 20; j++) {
        list.Add (new TKChartBubbleDataPoint (new NSNumber (r.Next () % 1450), new NSNumber (r.Next () % 150), new NSNumber (r.Next () % 200)));
    }

    TKChartBubbleSeries series = new TKChartBubbleSeries (list.ToArray());