UI for iOS has been discontinued. Please refer to this page for more information.
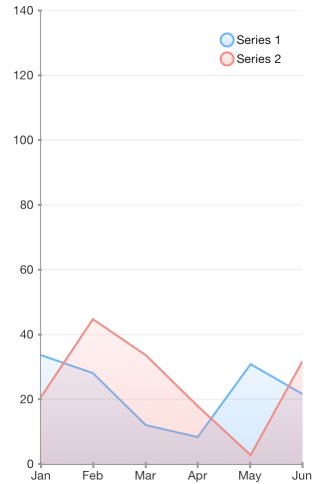
As a derivative of TKChartLineSeries series, TKChartAreaSeries plots its data points in line. Once positioned on a plane the points are connected to form a line. Further, the area enclosed between this line and the axis is filled. Below is a sample snippet that demonstrates how to set up two Area series:
pointsWithCategoriesAndValues = [[NSMutableArray alloc] init];
pointsWithCategoriesAndValues2 = [[NSMutableArray alloc] init];
NSArray *categories = @[ @"Greetings", @"Perfecto", @"NearBy", @"Family Store", @"Fresh & Green" ];
NSArray *values = @[ @70, @75, @58, @59, @88 ];
for (int i = 0; i < categories.count; i++) {
    TKChartDataPoint *dataPoint = [[TKChartDataPoint alloc] initWithX:categories[i] Y:values[i]];
    [pointsWithCategoriesAndValues addObject:dataPoint];
}

NSArray *values2 = @[ @40, @80, @35, @69, @95 ];
for (int i = 0; i < categories.count; i++) {
    TKChartDataPoint *dataPoint = [[TKChartDataPoint alloc] initWithX:categories[i] Y:values2[i]];
    [pointsWithCategoriesAndValues2 addObject:dataPoint];
}

TKChartAreaSeries* seriesForIncomes = [[TKChartAreaSeries alloc] initWithItems:pointsWithCategoriesAndValues];
[chart addSeries:seriesForIncomes];

TKChartAreaSeries *seriesForExpenses = [[TKChartAreaSeries alloc] initWithItems:pointsWithCategoriesAndValues2];
[chart addSeries:seriesForExpenses];
let categories = ["Greetings", "Perfecto", "NearBy", "Family Store", "Fresh & Green" ];
let values = [70, 75, 58, 59, 88]
for i in 0 ..< categories.count {
    pointsWithCategoriesAndValues.append(TKChartDataPoint(x: categories[i], y: values[i]))
}

let values2 = [40, 80, 32, 69, 95]
for i in 0 ..< categories.count {
    pointsWithCategoriesAndValues2.append(TKChartDataPoint(x: categories[i], y: values2[i]))
}

chart.addSeries(TKChartAreaSeries(items: pointsWithCategoriesAndValues))
chart.addSeries(TKChartAreaSeries(items: pointsWithCategoriesAndValues2))
var pointsWithCategoriesAndValues = new List<TKChartDataPoint> ();
var pointsWithCategoriesAndValues2 = new List<TKChartDataPoint> ();

var categories = new [] { "Greetings", "Perfecto", "NearBy", "Family Store", "Fresh & Green" };
var values = new [] { 70, 75, 58, 59, 88 };

for (int i = 0; i < categories.Length; ++i) {
    pointsWithCategoriesAndValues.Add (new TKChartDataPoint (new NSString (categories [i]), new NSNumber (values [i])));
}

var values2 = new [] { 40, 80, 32, 69, 95 };
for (int i = 0; i < categories.Length; ++i) {
    pointsWithCategoriesAndValues2.Add (new TKChartDataPoint (new NSString (categories [i]), new NSNumber (values2 [i])));
}

chart.AddSeries (new TKChartAreaSeries (pointsWithCategoriesAndValues.ToArray ()));
chart.AddSeries (new TKChartAreaSeries (pointsWithCategoriesAndValues2.ToArray ()));
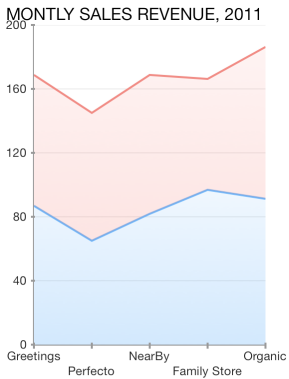
The TKChartAreaSeries can be combined by using different stack modes.
The Stack plots the points on top of each other:
TKChartStackInfo *stackInfo = [[TKChartStackInfo alloc] initWithID:@(1) withStackMode:TKChartStackModeStack];

TKChartAreaSeries *seriesForIncome = [[TKChartAreaSeries alloc] initWithItems:pointsWithCategoriesAndValues];
seriesForIncome.stackInfo = stackInfo;

TKChartAreaSeries *seriesForExpences = [[TKChartAreaSeries alloc] initWithItems:pointsWithCategoriesAndValues2];
seriesForExpences.stackInfo = stackInfo;

[chart beginUpdates];
[chart addSeries:seriesForIncome];
[chart addSeries:seriesForExpences];
[chart endUpdates];
let stackInfo = TKChartStackInfo(id: 1, with: TKChartStackMode.stack)

let seriesForIncome = TKChartAreaSeries(items: pointsWithCategoriesAndValues)
seriesForIncome.stackInfo = stackInfo

let seriesForExpenses = TKChartAreaSeries(items: pointsWithCategoriesAndValues2)
seriesForExpenses.stackInfo = stackInfo

chart.beginUpdates()
chart.addSeries(seriesForIncome)
chart.addSeries(seriesForExpenses)
chart.endUpdates()
var stackInfo = new TKChartStackInfo (new NSNumber (1), TKChartStackMode.Stack);

var seriesForIncome = new TKChartAreaSeries (pointsWithCategoriesAndValues.ToArray ());
seriesForIncome.StackInfo = stackInfo;

var seriesForExpenses = new TKChartAreaSeries (pointsWithCategoriesAndValues2.ToArray ());
seriesForExpenses.StackInfo = stackInfo;

chart.BeginUpdates ();
chart.AddSeries (seriesForIncome);
chart.AddSeries (seriesForExpenses);
chart.EndUpdates ();
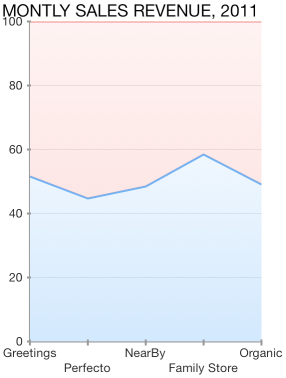
The Stack100 displays the value as percent:
If you want to change the series' fill and stroke, you should use the following code snippet:
TKChartAreaSeries* seriesForAnnualRevenue = [[TKChartAreaSeries alloc] initWithItems:pointsWithCategoriesAndValues];
seriesForAnnualRevenue.style.palette = [[TKChartPalette alloc] init];
TKChartPaletteItem *palleteItem = [[TKChartPaletteItem alloc] init];
palleteItem.stroke = [TKStroke strokeWithColor:[UIColor brownColor]];
palleteItem.fill = [TKSolidFill solidFillWithColor:[UIColor redColor]];
[seriesForAnnualRevenue.style.palette addPaletteItem:palleteItem];
[chart addSeries:seriesForAnnualRevenue];
let seriesForAnnualRevenue = TKChartAreaSeries(items: pointsWithCategoriesAndValues)
seriesForAnnualRevenue.style.palette = TKChartPalette()
let paletteItem = TKChartPaletteItem()
paletteItem.stroke = TKStroke(color: UIColor.brown)
paletteItem.fill = TKSolidFill(color: UIColor.red)
seriesForAnnualRevenue.style.palette!.addItem(paletteItem)
chart.addSeries(seriesForAnnualRevenue)
series.Style.Palette = new TKChartPalette ();
TKChartPaletteItem palleteItem = new TKChartPaletteItem ();
palleteItem.Stroke = new TKStroke(strokes[i], 1.5f);
palleteItem.Fill = new TKLinearGradientFill (fills[i], new CGPoint(0, 0), new CGPoint(1, 1));
series.Style.Palette.AddPaletteItem(palleteItem);