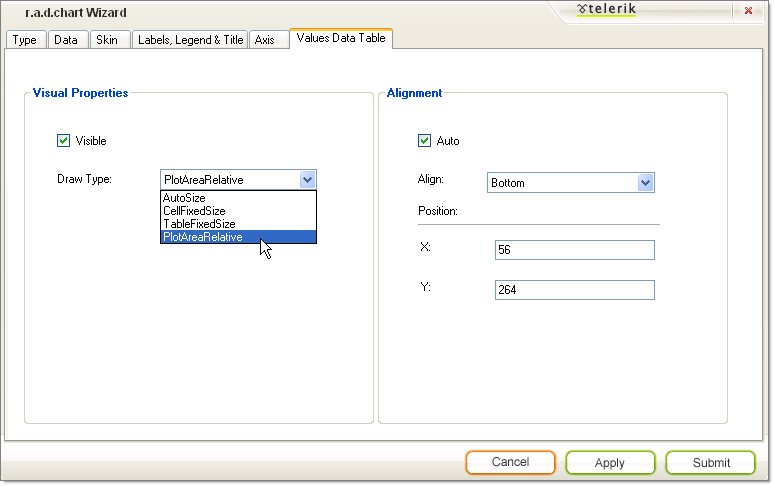
Understanding Wizard Values Data Table Tab
RadChart has been replaced by RadHtmlChart, Telerik's client-side charting component. If you are considering RadChart for new development, examine the RadHtmlChart documentation and online demos first to see if it will fit your development needs. If you are already using RadChart in your projects, you can migrate to RadHtmlChart by following these articles: Migrating Series, Migrating Axes, Migrating Date Axes, Migrating Databinding, Features parity. Support for RadChart is discontinued as of Q3 2014, but the control will remain in the assembly so it can still be used. We encourage you to use RadHtmlChart for new development.
The Values Data Table tab of the Wizard controls the general look and positioning of the chart data table.
Visual Properties
Check Visible to display the chart data table. By default this is unchecked.
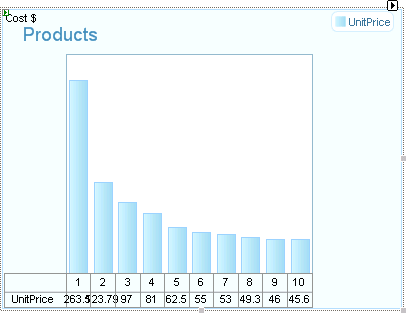
Select Draw Type from the drop down list to control the general size and positioning of the chart. Select AutoSize to have each cell size to the data inside of it.PlotAreaRelative places each cell just below the chart series item it represents. CellFixedSize and TableFixedSize fix the size of the cells or table irrespective of the data it contains.
Alignment
Use the Align drop down list to place the chart data table in a predefined position (e.g. Top, Bottom, BottomRight, etc.)To place the data table at exact coordinates, uncheck Auto and enter values for X and Y.