Spline Area Charts
RadChart has been replaced by RadHtmlChart, Telerik's client-side charting component. If you are considering RadChart for new development, examine the RadHtmlChart documentation and online demos first to see if it will fit your development needs. If you are already using RadChart in your projects, you can migrate to RadHtmlChart by following these articles: Migrating Series, Migrating Axes, Migrating Date Axes, Migrating Databinding, Features parity. Support for RadChart is discontinued as of Q3 2014, but the control will remain in the assembly so it can still be used. We encourage you to use RadHtmlChart for new development.
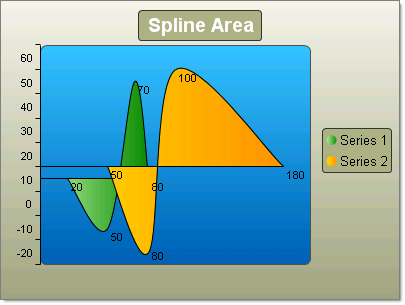
Spline charts allow you to take a limited set of known data points and approximate intervening values. In the Spline Area Chart the area defined by the spline curve is filled. In practice you define a series of chart items and RadChart does the rest. Each series overlays the preceding, from back to front.
To create a simple vertical Spline Area Chart set the SeriesOrientation property to Vertical. Set the RadChart DefaultType property or ChartSeries.Type to SplineArea. Create one or more series and add chart items with Y or X and Y values.
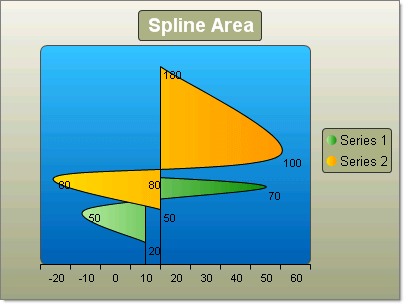
To create a simple horizontal Spline Area Chart set the SeriesOrientation property to Horizontal. Set the RadChart DefaultType property or ChartSeries.Type to SplineArea. Create a series and add chart items with Y or X and Y values.