Grouping databound items
RadChart has been replaced by RadHtmlChart, Telerik's client-side charting component. If you are considering RadChart for new development, examine the RadHtmlChart documentation and online demos first to see if it will fit your development needs. If you are already using RadChart in your projects, you can migrate to RadHtmlChart by following these articles: Migrating Series, Migrating Axes, Migrating Date Axes, Migrating Databinding, Features parity. Support for RadChart is discontinued as of Q3 2014, but the control will remain in the assembly so it can still be used. We encourage you to use RadHtmlChart for new development.
DataGroupColumn property defines the name of the column in the underlying datasource which will be the criteria for grouping the chart series items into series. There will be as many series as the number of distinct values in this column. For each value there will be a ChartSeries in the chart.
GroupNameFormat property defines a format for the legend item when grouping is applied. This format can include free text, which will be displayed in the legend items, as well as the following two special words:
#NAME - denotes the group column name
#VALUE - denotes the group column value (it is the same for all the records shown in the same series)
Example:
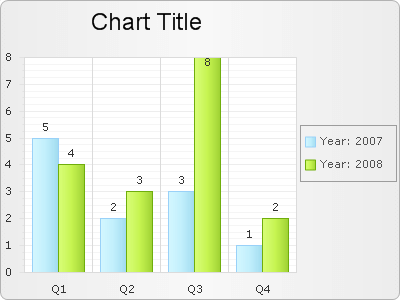
Consider a chart populated from the following table:
| Year | Quarter | Value |
|---|---|---|
| 2007 | Q1 | 5 |
| 2007 | Q2 | 2 |
| 2007 | Q3 | 3 |
| 2007 | Q4 | 1 |
| 2008 | Q1 | 4 |
| 2008 | Q2 | 3 |
| 2008 | Q3 | 8 |
| 2008 | Q4 | 2 |
Configure RadChart like this:
RadChart1.DataGroupColumn = "Year";
RadChart1.PlotArea.XAxis.DataLabelsColumn = "Quarter";
RadChart1.Legend.Appearance.GroupNameFormat = "#NAME:
#VALUE";
RadChart1.DataGroupColumn = "Year"
RadChart1.PlotArea.XAxis.DataLabelsColumn = "Quarter"
RadChart1.Legend.Appearance.GroupNameFormat = "#NAME:
#VALUE"
This is the result: