Binding to XML Directly at Run-Time
RadChart has been replaced by RadHtmlChart, Telerik's client-side charting component. If you are considering RadChart for new development, examine the RadHtmlChart documentation and online demos first to see if it will fit your development needs. If you are already using RadChart in your projects, you can migrate to RadHtmlChart by following these articles: Migrating Series, Migrating Axes, Migrating Date Axes, Migrating Databinding, Features parity. Support for RadChart is discontinued as of Q3 2014, but the control will remain in the assembly so it can still be used. We encourage you to use RadHtmlChart for new development.
To bind to the data in code at runtime to the XML file directly, use the Server.MapPath property to locate the XML on disk. The example code below has code that assigns the data and data labels columns as well as massaging the general appearance of the chart.The two critical lines of code that you must have to minimally bind to the XML file are the assignment of the DataSource and the call to DataBind().
// assign the data source
RadChart1.DataSource = Server.MapPath("-/Products.xml");
RadChart1.Series[0].DataYColumn = "QuantityInStock";
RadChart1.PlotArea.XAxis.DataLabelsColumn = "Name";

// assign appearance related properties
RadChart1.PlotArea.XAxis.Appearance.LabelAppearance.RotationAngle = 300;
RadChart1.PlotArea.XAxis.Appearance.TextAppearance.TextProperties.Font =
 new System.Drawing.Font("Verdana", 6, System.Drawing.FontStyle.Bold);
RadChart1.PlotArea.XAxis.Appearance.TextAppearance.TextProperties.Color =
 System.Drawing.Color.BlueViolet;
RadChart1.PlotArea.Appearance.Dimensions.Margins.Bottom =
 Telerik.Charting.Styles.Unit.Percentage(20);

// bind to the chart
RadChart1.DataBind();
' assign the data source
RadChart1.DataSource = Server.MapPath("-/Products.xml")
RadChart1.Series(0).DataYColumn = "QuantityInStock"
RadChart1.PlotArea.XAxis.DataLabelsColumn = "Name"
' assign appearance related properties
RadChart1.PlotArea.XAxis.Appearance.LabelAppearance.RotationAngle = 300
RadChart1.PlotArea.XAxis.Appearance.TextAppearance.TextProperties.Font = New System.Drawing.Font("Verdana", 6, System.Drawing.FontStyle.Bold)
RadChart1.PlotArea.XAxis.Appearance.TextAppearance.TextProperties.Color = System.Drawing.Color.BlueViolet
RadChart1.PlotArea.Appearance.Dimensions.Margins.Bottom = Telerik.Charting.Styles.Unit.Percentage(20)
' bind to the chart
RadChart1.DataBind()
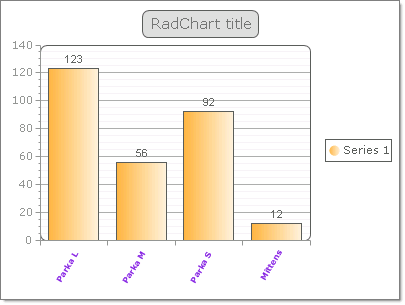
The running application looks something like the figure shown below.