Localization Example Using Global Resources, Explicit Expression
RadChart has been replaced by RadHtmlChart, Telerik's client-side charting component. If you are considering RadChart for new development, examine the RadHtmlChart documentation and online demos first to see if it will fit your development needs. If you are already using RadChart in your projects, you can migrate to RadHtmlChart by following these articles: Migrating Series, Migrating Axes, Migrating Date Axes, Migrating Databinding, Features parity. Support for RadChart is discontinued as of Q3 2014, but the control will remain in the assembly so it can still be used. We encourage you to use RadHtmlChart for new development.
This tutorial will demonstrate localizing the RadChart title using a global resource and binding it to the title with an explicit expression. See Multi-Language Support for RadChart for an overview of localization options.
Create a simple ASP.NET AJAX enabled RadChart application. See Quick Start: Create a Bar Chart with Simple Static Data for an example. The following steps assume the web page is named "default.aspx".
-
Paste the following ASP.NET HTML definition of the chart:
ASP.NET
<telerik:RadChart ID="RadChart1" runat="server">
<PlotArea>
   <XAxis MaxValue="3" MinValue="1" Step="1"></XAxis>
   <YAxis MaxValue="50"></YAxis>
</PlotArea>
<ChartTitle><TextBlock Text="Sales"></TextBlock></ChartTitle>
<Series>
   <radC:ChartSeries Name="Series 1">
       <items>
               <radC:ChartSeriesItem YValue="50">
                   <Label><TextBlock Text="One"></TextBlock></Label>
               </radC:ChartSeriesItem>
               <radC:ChartSeriesItem YValue="30">
                   <Label><TextBlock Text="Two"></TextBlock></Label>
               </radC:ChartSeriesItem>
               <radC:ChartSeriesItem YValue="20">
                   <Label><TextBlock Text="Three"></TextBlock></Label>
               </radC:ChartSeriesItem>
           </items>
   </radC:ChartSeries>
</Series>
</telerik:RadChart>
In the Solution Explorer, right-click the project and select Add | Add ASP.NET Folder | App_GlobalResources from the context menu.
Right-click App_GlobalResources and click Add | New Item| Resource File from the context menu.Name the resource MyGlobals.resx.
In the Solution Explorer, double-click MyGlobals.resx and add an entry named "Title" with value "Top Ten Sales".
In the Solution Explorer, copy MyGlobals.resx to MyGlobals.fr-FR.resx.
In the Solution Explorer, double-click MyGlobals.fr-FR.resx and add the entry named "Title" with value "Ventes du principal dix".
-
In the ASP.NET HTML markup for the page add the explicit expression "<%$ Resources:MyGlobals, Title %>" to the Textattribute for the chart title. The ASP.NET HTML markup for the chart title should now look like this:
ASP.NET
<ChartTitle>
   <TextBlock Text="<$ Resources>">
   </TextBlock>
</ChartTitle>
Run the application. The chart title should still be "Top Ten Sales".
In the web browser (we will assume Internet Explorer for this example), select Tools | Internet Options | Languages.
In the Language Preference dialog click the Add button.
Locate the France "fr-FR" culture code and click OK.
If there are other languages in the Language Preference dialog list, use the arrow keys to place "fr-FR" at the top of the list.
Click the OK button to close the Language Preference dialog.
Click OK to close the Internet Options dialog.
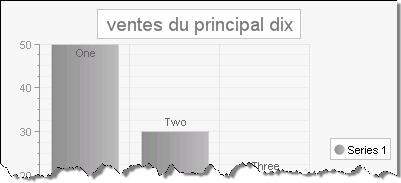
Refresh the browser page.The title should now be localized to "Ventes du principal dix".