Metrics View
This article is relevant to entity models that utilize the deprecated Visual Studio integration of Telerik Data Access. The current documentation of the Data Access framework is available here.
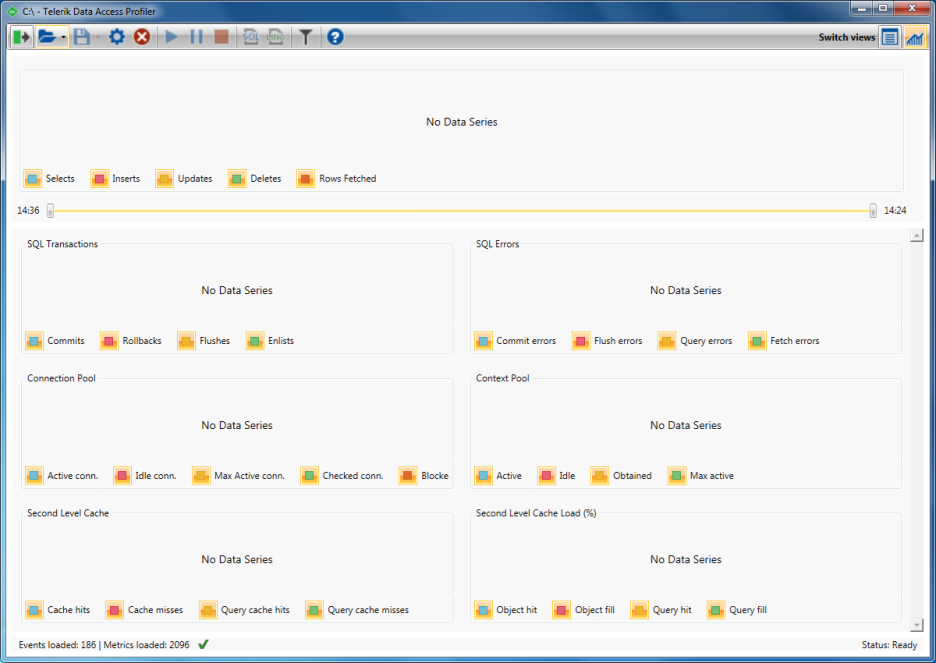
Telerik Data Access produces two different kinds of data - metrics and events. Metrics are similar to the operating system counters. They produce snapshots of the system status like counting insert, update and delete statements per second. Respectively, the Metrics View is the place where you could get visual information about these parameters.
Metric Views
The Telerik Data Access Profiler provides visual information about the following metrics:
-
SQL Transactions
- Commits – committed ADO transactions.
- Rollbacks – cancelled ADO transactions.
- Flushes – flushed transactions, all write operations are executed but the transaction is still running.
- Enlists – ADO connection enlistments into a distributed transaction.
-
SQL Errors
- Commit errors – errors during transaction commit operations.
- Flush errors – errors during transaction flush operations.
- Query errors – errors reported from relational server executing SQL operations.
- Fetch errors – errors occurred during ADO read operations.
-
Connection Pool
- Active connections – currently opened and used ADO connections.
- Idle connections – currently opened but unused connections.
- Max Active connections – amount of maximum in parallel used connections.
- Checked connections – amount of connections checked because of it’s age or a former error situation. Each check is an additional client/server call.
- Blocked connection requests – application had to wait for a free connection in the pool because the max active connection count was reached.
-
Contexts
- Active – currently used context instances.
- Idle – currently unused but pooled context instances.
- Obtained – amount of created user context instances.
- Max active – maximum parallel context instances used by the application.
-
Second Level Cache
- Cache hits – objects successfully obtained from the cache.
- Cache misses – objects failed to be obtained from the cache.
- Query cache hits – query results successfully obtained from the cache.
- Query cache misses – query results failed to be obtained from the cache.
-
Second Level Cache Load (%)
- Object hit – percentage of the successfully obtained objects from the cache.
- Object fill – current load of the object cache (%).
- Query hit – percentage of the successfully obtained query results from the cache.
- Query fill – current load of the query result cache (%).
How to Show the Metrics View
By default, when you start the Telerik Data Access Profiler, the Events View is the active one. To switch to the Metrics View, you need to use the Metrics View Toolbar Command.

How to Configure the Metrics View
You could show/hide the chart controls from the Metrics View settings in the Profiler Settings Dialog.