Tracing and Logging
This article is relevant to entity models that utilize the deprecated Visual Studio integration of Telerik Data Access. The current documentation of the Data Access framework is available here.
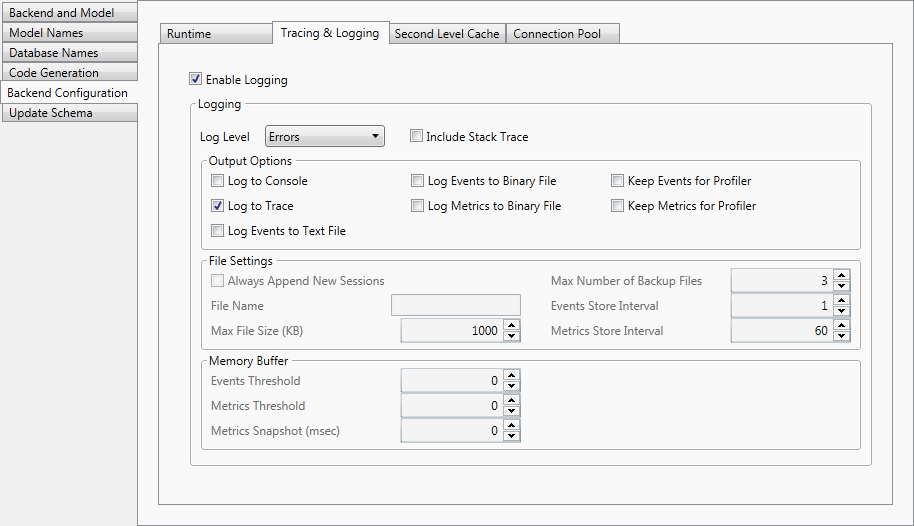
The Tracing & Logging settings allows you to configure the event logging properties, such as specifying the log file name, controlling the amount of logging information to be generated, etc.
- Enable Logging - specifies whether the logging functionality is enabled.
-
Log Level - specifies the amount of logging information to be generated. The Log Level setting is enabled only if the Enable Logging option is True. The event logging levels for the events to log property are as follows:
- None - logs no events.
- Errors - logs only serious errors (such as connections timing out). This is the default value.
- Normal - logs the most useful events that do not reduce performance significantly (e.g. SQL executed).
- Verbose - logs lots of events (this slows down the performance, could be used while debugging).
- All - logs all possible events (this slows down the performance very significantly, could be used while debugging).
- Include Stack Trace - controls if the logging facilities append stack trace information. Enabling this setting may affect the performance of your application. The Include Stack Trace setting is enabled only if the Enable Logging option is True.
Output Options
All Output Options are enabled only if the Enable Logging option is True.
- Log to Console - specifies whether the logging information is printed to the console or not. Default value is False.
- Log to Trace - specifies whether the logging information will be traced to a TraceListener or not. Default value is True.
- Log Events to Text File - specifies whether the logging information is written to a text file or not. Default value is False. Setting this option to True will enable the File Settings.
- Log Events to Binary File - specifies whether events should be logged in binary form or not. Default value is False. Setting this option to True will enable the File and Events Threshold settings.
- Log Metrics to Binary File - specifies whether metrics should be logged in binary form or not. Default value is False. Setting this option to True will enable the File, Metrics Threshold and Metrics Snapshot settings.
- Keep Events for Profiler - allows the user to configure the events store. Setting this option to True will enable the Events Threshold option.
- Keep Metrics for Profiler - allows the user to configure the metrics store. Setting this option to True will enable the Metrics Threshold and Metrics Snapshot options.
File Settings
- Always Append New Sessions - specifies whether the output is appended to an existing log file or if overwrite is performed. Default value is False.
- File Name - specifies the file name for the log output.
- Max File Size(KB) - specifies the max size of the log file in KB.
- Max Number of Backup Files - the number of old log files that Telerik Data Access keeps on the file system. After that number is exceeded, Telerik Data Access deletes the first log file before creating a new one. By default the maximum size of the log files is 1000KB and the maximum amount of historical files is 3. If the log file reaches the configured maximum size, it is renamed to fileName.1. If a file with name fileName.1 already exists, then it is renamed to fileName.2. If the maximum number of files has been reached, the oldest file is deleted. The new data will be stored in a new file.
- Events Store Interval (sec) - controls the time in seconds between polls of the event ring buffer. The store interval for events is important. If the process generates more events than the configured buffer can store before the background process wakes up, the events are lost. By default, events are written in interval of 1 second.
- Metrics Store Interval (sec) - controls the time in seconds between polls of the metric snapshot ring buffer.
Memory Buffer
- Events Threshold - controls the maximum number of log events stored in the ring buffer.
- Metrics Threshold - controls the capacity of the metric snapshot store.
- Metrics Snapshot (msec) - controls the interval to perform metric snapshots in milliseconds.